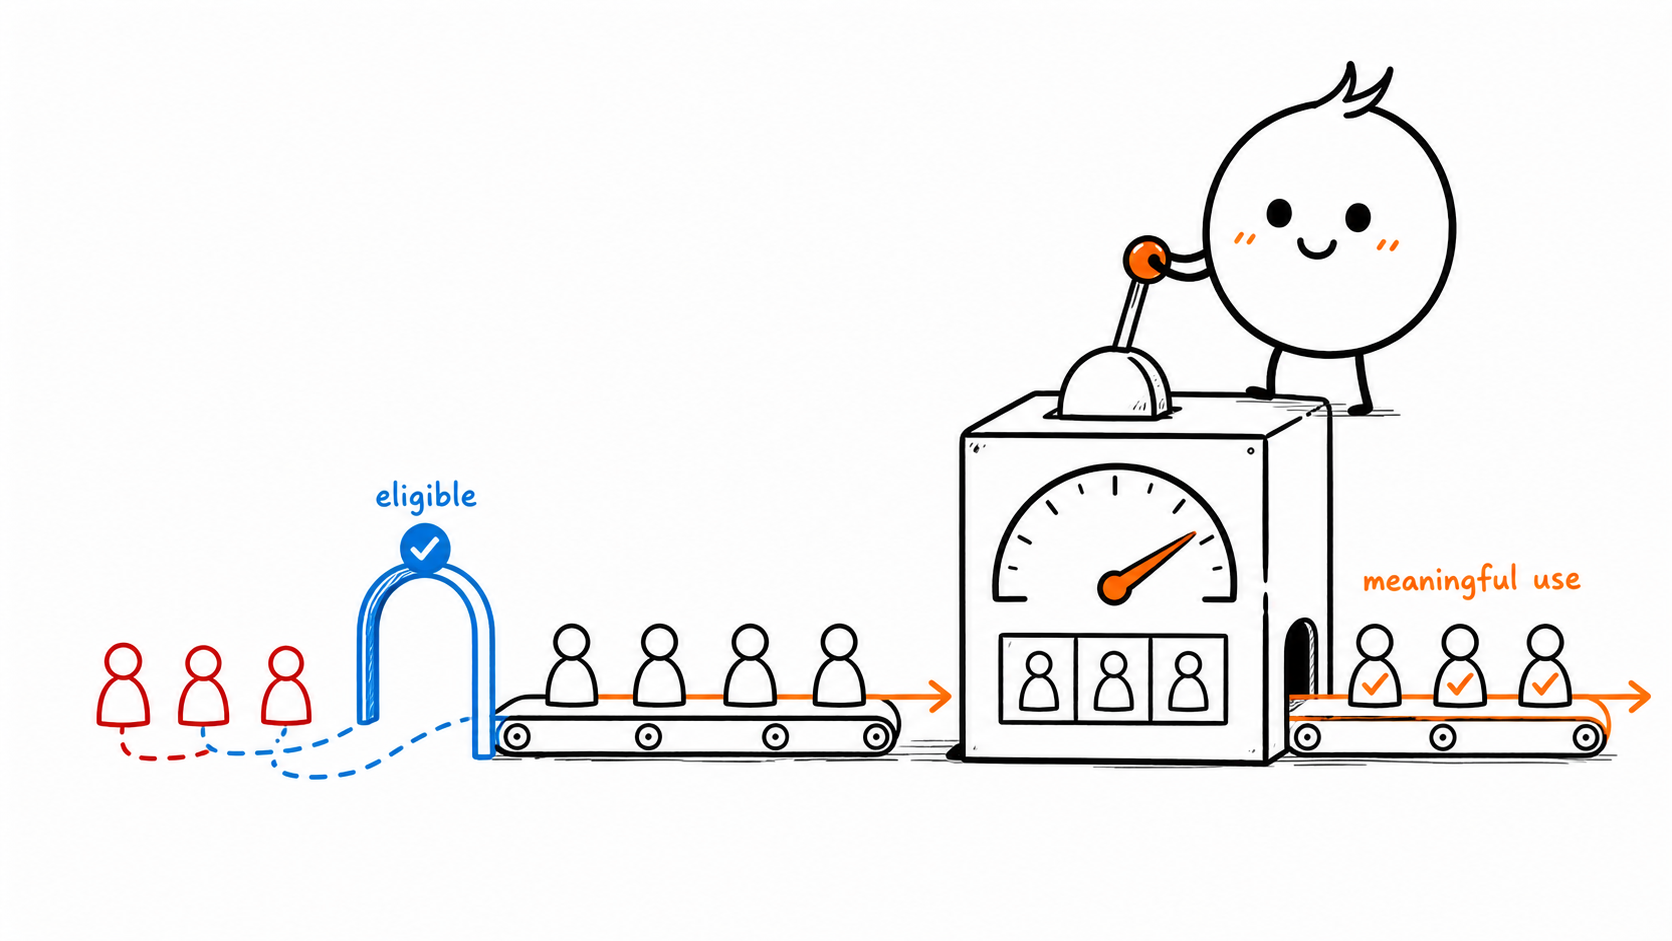









Interactive demo analytics should answer three questions: did the right people engage, did the story move them through the workflow, and did the experience create the next product action? Track sessions or visits and source for reach; engagement, completion, step drop-off, hotspot or CTA clicks, and form or lead activity for behavior; then connect those signals to signup, a booked meeting, first workflow completion, and retained use. Views belong in the report, but they are a distribution measure, not proof of understanding or pipeline.
The interactive demo analytics scorecard
Start with a small scorecard that matches the job of the demo. The point is to connect each number to a decision, not to collect every possible event.
| Question | Track | Decision it supports |
|---|---|---|
| Did the intended audience arrive? | Sessions or visits by source, placement, campaign, and audience | Keep, move, or retire a distribution channel |
| Did viewers deliberately engage? | Engagement, first interaction, steps reached, and time spent where available | Improve the opening, context, or targeting |
| Did the workflow make sense? | Completion, step-level reach, and drop-off | Shorten, reorder, or clarify the experience |
| Did a viewer show intent? | Hotspot clicks, CTA clicks, form starts, and leads | Improve the handoff and qualification path |
| Did the lead fit the business? | Qualified leads, account fit, role, and campaign context | Separate useful demand from raw form volume |
| Did the demo create product value? | Signup, activation, first meaningful workflow, and repeat use | Prove or disprove the demo's business job |
Image source: Userorbit Interactive Product Demos.
Demo analytics and product analytics answer different questions
Keep the boundary clear:
- Demo analytics describe what happened inside the published experience: a visit, a meaningful interaction, a step reached, a completion, a hotspot or CTA click, a form submission, or a captured lead.
- Product analytics describe what happened in the live application after the viewer followed the next step: signup, workspace creation, an invited teammate, a published workflow, a feature event, or a return visit.
A demo platform can report that someone completed a walkthrough. It cannot, by that fact alone, prove that the person understood the product, became a qualified opportunity, or used the live feature. Join the two layers with a stable identifier, campaign context, or an explicitly documented attribution window.
1. Measure reach without mistaking it for success
Views are still useful. They tell you whether a page, sales follow-up, announcement, or help article is getting the player in front of people. But a raw view count mixes together very different situations: a real prospect who explores ten steps, a page impression that loads the player below the fold, a teammate checking a draft, and a repeat visitor returning to the same workflow.
At minimum, break reach down by:
- Placement: product page, comparison page, sales link, announcement, help article, onboarding, or in-app resource center.
- Source: campaign, referrer, email, sales sequence, or direct link.
- Audience: prospect, customer, partner, internal reviewer, or unknown visitor.
- Workflow and version: which demo was viewed and which revision was live.
- Time window: launch week, steady state, and the period after a meaningful product change.
Use sessions or visits consistently. If one report counts every player load and another counts unique viewers, do not compare their totals or calculate one blended rate. Document whether the denominator is a session, a visitor, a user, or an account.
2. Track deliberate engagement
Engagement is the first signal that a viewer did more than encounter the player. Depending on the reporting surface, it may include an interaction, a step advance, a hotspot click, or another meaningful demo event.
Define the event before publishing. For example:
An engaged demo session is a session in which the viewer advances past the opening step or clicks a guided hotspot.
That definition makes a channel comparison possible. A product page may generate many views and few engaged sessions, while a sales link may produce fewer views but much deeper exploration. Both results are useful when the team knows which job each channel is supposed to perform.
Do not invent a universal time threshold such as “engaged means 30 seconds.” A short five-step demo and a long technical workflow have different natural durations. Use an action or step threshold when you can, then keep the definition beside the chart.
3. Use completion to diagnose the story, not to crown a winner
Completion tells you how many viewers reached the end of the intended path. It is valuable for spotting confusing or overly long demos, but a high completion rate is not automatically good. A two-step demo can achieve high completion while explaining too little, and a detailed technical demo can be useful even when the right buyers pause or leave before the last step.
Choose one denominator and keep it stable:
| Rate | Formula | Use it when... |
|---|---|---|
| Session completion rate | Completed sessions ÷ demo sessions | You want the share of all sessions that reached the end |
| Engaged completion rate | Completed engaged sessions ÷ engaged sessions | You want to remove passive loads from the question |
| Qualified completion rate | Completed sessions from the target audience ÷ target-audience sessions | The demo is designed for a specific buyer or customer segment |
If the reporting tool exposes a distinct start event, use it only when the start definition is consistent across the demo and reporting period. If it exposes visits, engagement, and completion instead, document that denominator rather than quietly calling visits “starts.”
Read completion alongside the next action. A viewer who completes the demo and clicks the CTA is different from a viewer who completes it, closes the tab, and never returns. Neither is inherently bad until the demo's job is stated.
4. Find the step where intent or understanding breaks
Overall completion hides the most actionable part of the path: the step where viewers stop, hesitate, or take a different route.
Track:
- viewers entering each step
- viewers advancing from each step
- exits or drop-offs at each step
- hotspot clicks and mis-clicks where the tool exposes them
- time spent on a step when it is available and comparable
- the next action after the step, such as a form, CTA, or live-product visit
The basic step-drop-off formula is:
Step drop-off = viewers who exit at the step ÷ viewers who reached the step × 100
Do not interpret every drop-off as a content failure. A pricing step may filter out poor-fit traffic. A form may be intentionally selective. A technical setup step may be exactly where the viewer decides whether the product is credible. Segment the drop-off by audience, source, and workflow before rewriting the demo.
5. Separate curiosity clicks from buying intent
Hotspots and CTAs reveal what a viewer tried to do next, but the click itself is not a business outcome.
Useful intent measures include:
- Hotspot click rate: hotspot clicks ÷ engaged sessions, when the hotspot represents a meaningful exploration action.
- CTA click-through rate: CTA clicks ÷ engaged sessions or demo sessions, with the denominator stated.
- Form start rate: form starts ÷ engaged sessions.
- Lead capture rate: captured leads ÷ demo sessions or engaged sessions.
- Qualified lead rate: qualified leads ÷ captured leads.
- Demo-assisted opportunity rate: opportunities with a qualifying demo touch ÷ captured or qualified leads.
A form should collect only the information the follow-up process can use. If a demo is embedded in a help article, asking for a full sales qualification form is likely to damage self-serve support. If it is used in a high-intent sales sequence, a short account or role field may be enough to route the follow-up.
Keep lead capture and privacy decisions explicit. The Userorbit demo analytics help article recommends collecting only the lead information the team needs and handling it according to its privacy policy.
6. Connect the demo to a downstream product action
The most important metric depends on why the demo exists:
| Demo job | Downstream action to define |
|---|---|
| Pre-sale evaluation | Signup, booked meeting, qualified opportunity, or pricing-page visit |
| Product marketing launch | Feature page visit, eligible-user exposure, or first use of the launched feature |
| Onboarding preparation | Workspace setup, invited teammate, first project, or first meaningful workflow |
| Customer success enablement | Account-level workflow completion, expansion signal, or reduced repeated question |
| Help content | Successful setup, self-serve resolution, or lower escalation for the documented task |
Write the handoff as an event sequence. For example:
demo_session_started → demo_engaged → demo_completed → signup_completed
→ workspace_created → first_target_workflow_completed
The exact event names should match the product's existing tracking convention. Avoid generic button_clicked events when a stable business event such as workspace_created or report_published is available.
For a pre-signup demo, preserve a first-party link between the demo touch and the signup when the user consents and the implementation supports it. For anonymous traffic, use a documented campaign or session approach and report the result as assisted influence, not as guaranteed causation.
7. Measure repeat use and retention when the demo is part of a lifecycle
Some demos are one-time sales assets. Others are reused in onboarding, help, announcements, and customer-success follow-up. A repeat visit can mean the workflow is valuable, the viewer is comparing options, or the instructions were not clear enough on the first pass.
Track return behavior only when it answers a real question:
- Did a prospect revisit after a sales conversation?
- Did a new customer return to the same workflow during onboarding?
- Did an account revisit a launch demo before using the feature?
- Did demo-engaged users perform the live product action again in the next period?
Userorbit Analytics documents Retention reports for comparing an initial event with a returning event. Apply the same discipline to demo-assisted adoption: define the initial demo event, the returning product event, the time window, and the eligible population. Do not label a repeat demo visit as product retention.
The formulas worth putting beside the dashboard
Keep the definitions visible so the report remains understandable after the author changes.
| Metric | Formula | What it answers |
|---|---|---|
| Engagement rate | Engaged sessions ÷ demo sessions × 100 | Did the audience interact deliberately? |
| Completion rate | Completed sessions ÷ chosen denominator × 100 | Did viewers reach the intended end? |
| Step drop-off | Exits at step ÷ viewers reaching step × 100 | Where does the path lose people? |
| CTA click rate | CTA clicks ÷ chosen session denominator × 100 | Did the handoff attract action? |
| Lead capture rate | Captured leads ÷ chosen session denominator × 100 | Did the demo produce identifiable interest? |
| Qualified lead rate | Qualified leads ÷ captured leads × 100 | Was the interest a fit for the business? |
| Demo-assisted activation | Activated demo-touched signups ÷ eligible demo-touched signups × 100 | Did the demo precede the intended live action? |
“Chosen denominator” is deliberate. Write whether the calculation uses all sessions, engaged sessions, unique viewers, or a target segment. A rate without its entity, eligibility rule, and window is easy to misread and difficult to improve.
A hypothetical demo measurement example
The following numbers are illustrative, not a benchmark or Userorbit result. They show how a team can read a demo funnel without celebrating a single top-line number.
A SaaS team publishes a reporting demo for a product-marketing launch and reviews one month:
- 1,000 demo sessions
- 620 engaged sessions
- 310 completed sessions
- 90 CTA clicks
- 42 captured leads
- 28 qualified leads
- 18 signups attributed to a qualifying demo touch
- 11 new workspaces completed the target reporting workflow
The scorecard becomes:
| Metric | Calculation | Result |
|---|---|---|
| Engagement rate | 620 ÷ 1,000 | 62% |
| Session completion rate | 310 ÷ 1,000 | 31% |
| Engaged completion rate | 310 ÷ 620 | 50% |
| CTA click rate | 90 ÷ 1,000 | 9% |
| Lead capture rate | 42 ÷ 1,000 | 4.2% |
| Qualified lead rate | 28 ÷ 42 | 66.7% |
| Target-workflow activation among demo-touched signups | 11 ÷ 18 | 61.1% |
The useful question is not “is 31% completion good?” The useful questions are:
- Which sources produced the 620 engaged sessions?
- Where did the 310 completed sessions drop out of the path?
- Did the CTA send the right people to signup or only create low-fit leads?
- What did the 18 demo-touched signups do differently from signups that never engaged?
- Did the 11 activated workspaces use the feature again?
If the answer to the last question is not yet available, the team has a tracking gap, not proof that the demo failed.
Segment the scorecard before changing the demo
An overall rate can hide a strong experience for one audience and a broken one for another. Use a small set of dimensions that can change the product or distribution decision.
| Segment | Why it matters |
|---|---|
| Source and placement | A demo can work in a sales follow-up but distract from a help article. |
| Buyer or user role | Product marketers, evaluators, admins, and end users may need different paths. |
| Lifecycle stage | Pre-signup exploration and post-signup enablement have different success events. |
| Account size or plan | Eligibility, urgency, and expected workflow depth can vary by account. |
| Demo version or workflow | A shortened revision should not be compared with a longer historical asset without annotation. |
| Device and browser | Mobile or embedded-player constraints can create step loss that desktop rates hide. |
| Release or campaign cohort | A launch spike is not the same as steady-state demand. |
Pass these properties as event or user context where the analytics system supports them, or join them from campaign, CRM, and product data. Do not create ten segments before you have enough observations to act on one.
A practical weekly measurement workflow
Use this six-step review for every important demo:
- State the job: write the audience, workflow, next action, and time window in one sentence.
- Version the experience: record the demo, capture revision, CTA, placement, and campaign source.
- Verify the event path: test a session, step progression, CTA, form, lead record, and downstream product event with a safe test account.
- Build the scorecard: report reach, engagement, completion, step loss, intent, qualified demand, and the downstream action.
- Find one controllable loss: choose the largest stage loss that the team can change without changing the audience and offer simultaneously.
- Review the next period: check whether the edit improved the target stage while quality and downstream activation stayed healthy.
Do not change the demo, landing page, CTA, audience, and attribution window at the same time. You may get a different number, but you will not know which decision caused it.
How Userorbit fits the measurement job
Userorbit is a strong fit when the demo is part of a larger SaaS product-education system. Its Interactive Demos product page describes Chrome-extension capture, editable captured screens, hotspots and guided steps, forms and lead capture, demo collections, share links, embeds, and demo analytics for completions, drop-offs, CTA clicks, and downstream product usage. The canonical Interactive Product Demos launch post explains how teams reuse the same workflow across evaluation, onboarding, help, launches, and adoption.
The current demo analytics help article documents visits, engagement, completion, step information, and lead views. Use those demo-level signals to diagnose the published experience. Then use Userorbit Analytics and its Analytics and Reporting guide for live-product events, dashboards, segments, cohorts, goals, and custom metrics. Report types cover Insights, Funnels, Retention, and LTV questions.
That combination is useful when a product, marketing, growth, or customer-success team wants to keep the demo-to-adoption handoff in one workspace. It is less important if the only requirement is anonymous top-of-funnel views and a specialist sales-analytics platform already owns the full attribution model.
Userorbit plan availability
The pricing page checked on September 14, 2026 lists Analytics and integrations as base features. It lists Interactive Demos on Scale and Enterprise, not Growth.
| Plan | Listed price | Analytics | Interactive Demos |
|---|---|---|---|
| Growth | $95/month with annual billing | Included | Not included |
| Scale | $249/month with annual billing | Included | Included |
| Enterprise | Custom | Included with custom limits and retention | Included |
The billing help article adds an important entitlement caveat: Interactive Demos can be available during an active trial or through a workspace-specific override. Confirm the current workspace access before treating a plan table as an implementation guarantee.
Common mistakes in interactive demo reporting
Optimizing for views alone
Views can rise because distribution improved, not because the demo became clearer. Pair reach with deliberate engagement and the next action.
Reporting completion without the denominator
“Completion rate” is not comparable when one report divides by sessions and another divides by engaged viewers. Put the denominator beside the chart.
Treating a captured lead as a qualified opportunity
A lead is an identifiable response. Qualification, account fit, opportunity creation, and revenue are later states that need their own definitions.
Claiming that demo engagement caused activation
A highly motivated buyer may both complete the demo and activate quickly. Unless the team runs a valid experiment or controls for meaningful confounders, describe the result as demo-assisted or associated, not causal proof.
Changing the asset and the measurement contract together
If the event names, eligibility rules, denominator, or attribution window change, version the metric and annotate the dashboard. Otherwise a trend break can look like a product result.
Collecting more personal data than the workflow needs
Lead capture should have a clear owner, purpose, retention rule, and follow-up path. A larger form is not automatically a better qualification system.
Frequently asked questions
Interactive demo analytics FAQ
Direct answers for SaaS teams measuring demo engagement, intent, and product adoption.
The short version
Track views to understand distribution, but make decisions from the full path:
- Reach: did the intended audience arrive?
- Engagement: did viewers interact deliberately?
- Understanding: where did they complete, pause, or drop off?
- Intent: did they click, submit, or raise a qualified hand?
- Handoff: did they signup, book, or open the live product?
- Adoption: did they complete and repeat the workflow the demo promised?
If your team owns marketing, onboarding, support, launches, and product adoption, an interactive demo becomes more valuable when its reporting follows the same customer journey. Explore Userorbit's interactive demos, review the product analytics workspace, and check current plan access before choosing the first workflow to measure.
Measure the moment after the demo
Build one interactive workflow, connect its engagement to product events, and improve the path to adoption.