

Product Analytics for Deeper Insights
Measure feature adoption, explore funnels and retention, and watch user recordings with session replay. Understand how people use your product and where they need help.
Start for free, no credit card required
Visualize, Analyze, and Optimize Your Product
Userorbit Analytics empowers your team to track key metrics, understand user journeys, and continuously improve your product experience.
Track Feature Adoption & Usage
See which features drive engagement and which need attention. Analyze adoption trends, identify power users, and optimize your roadmap based on real data.
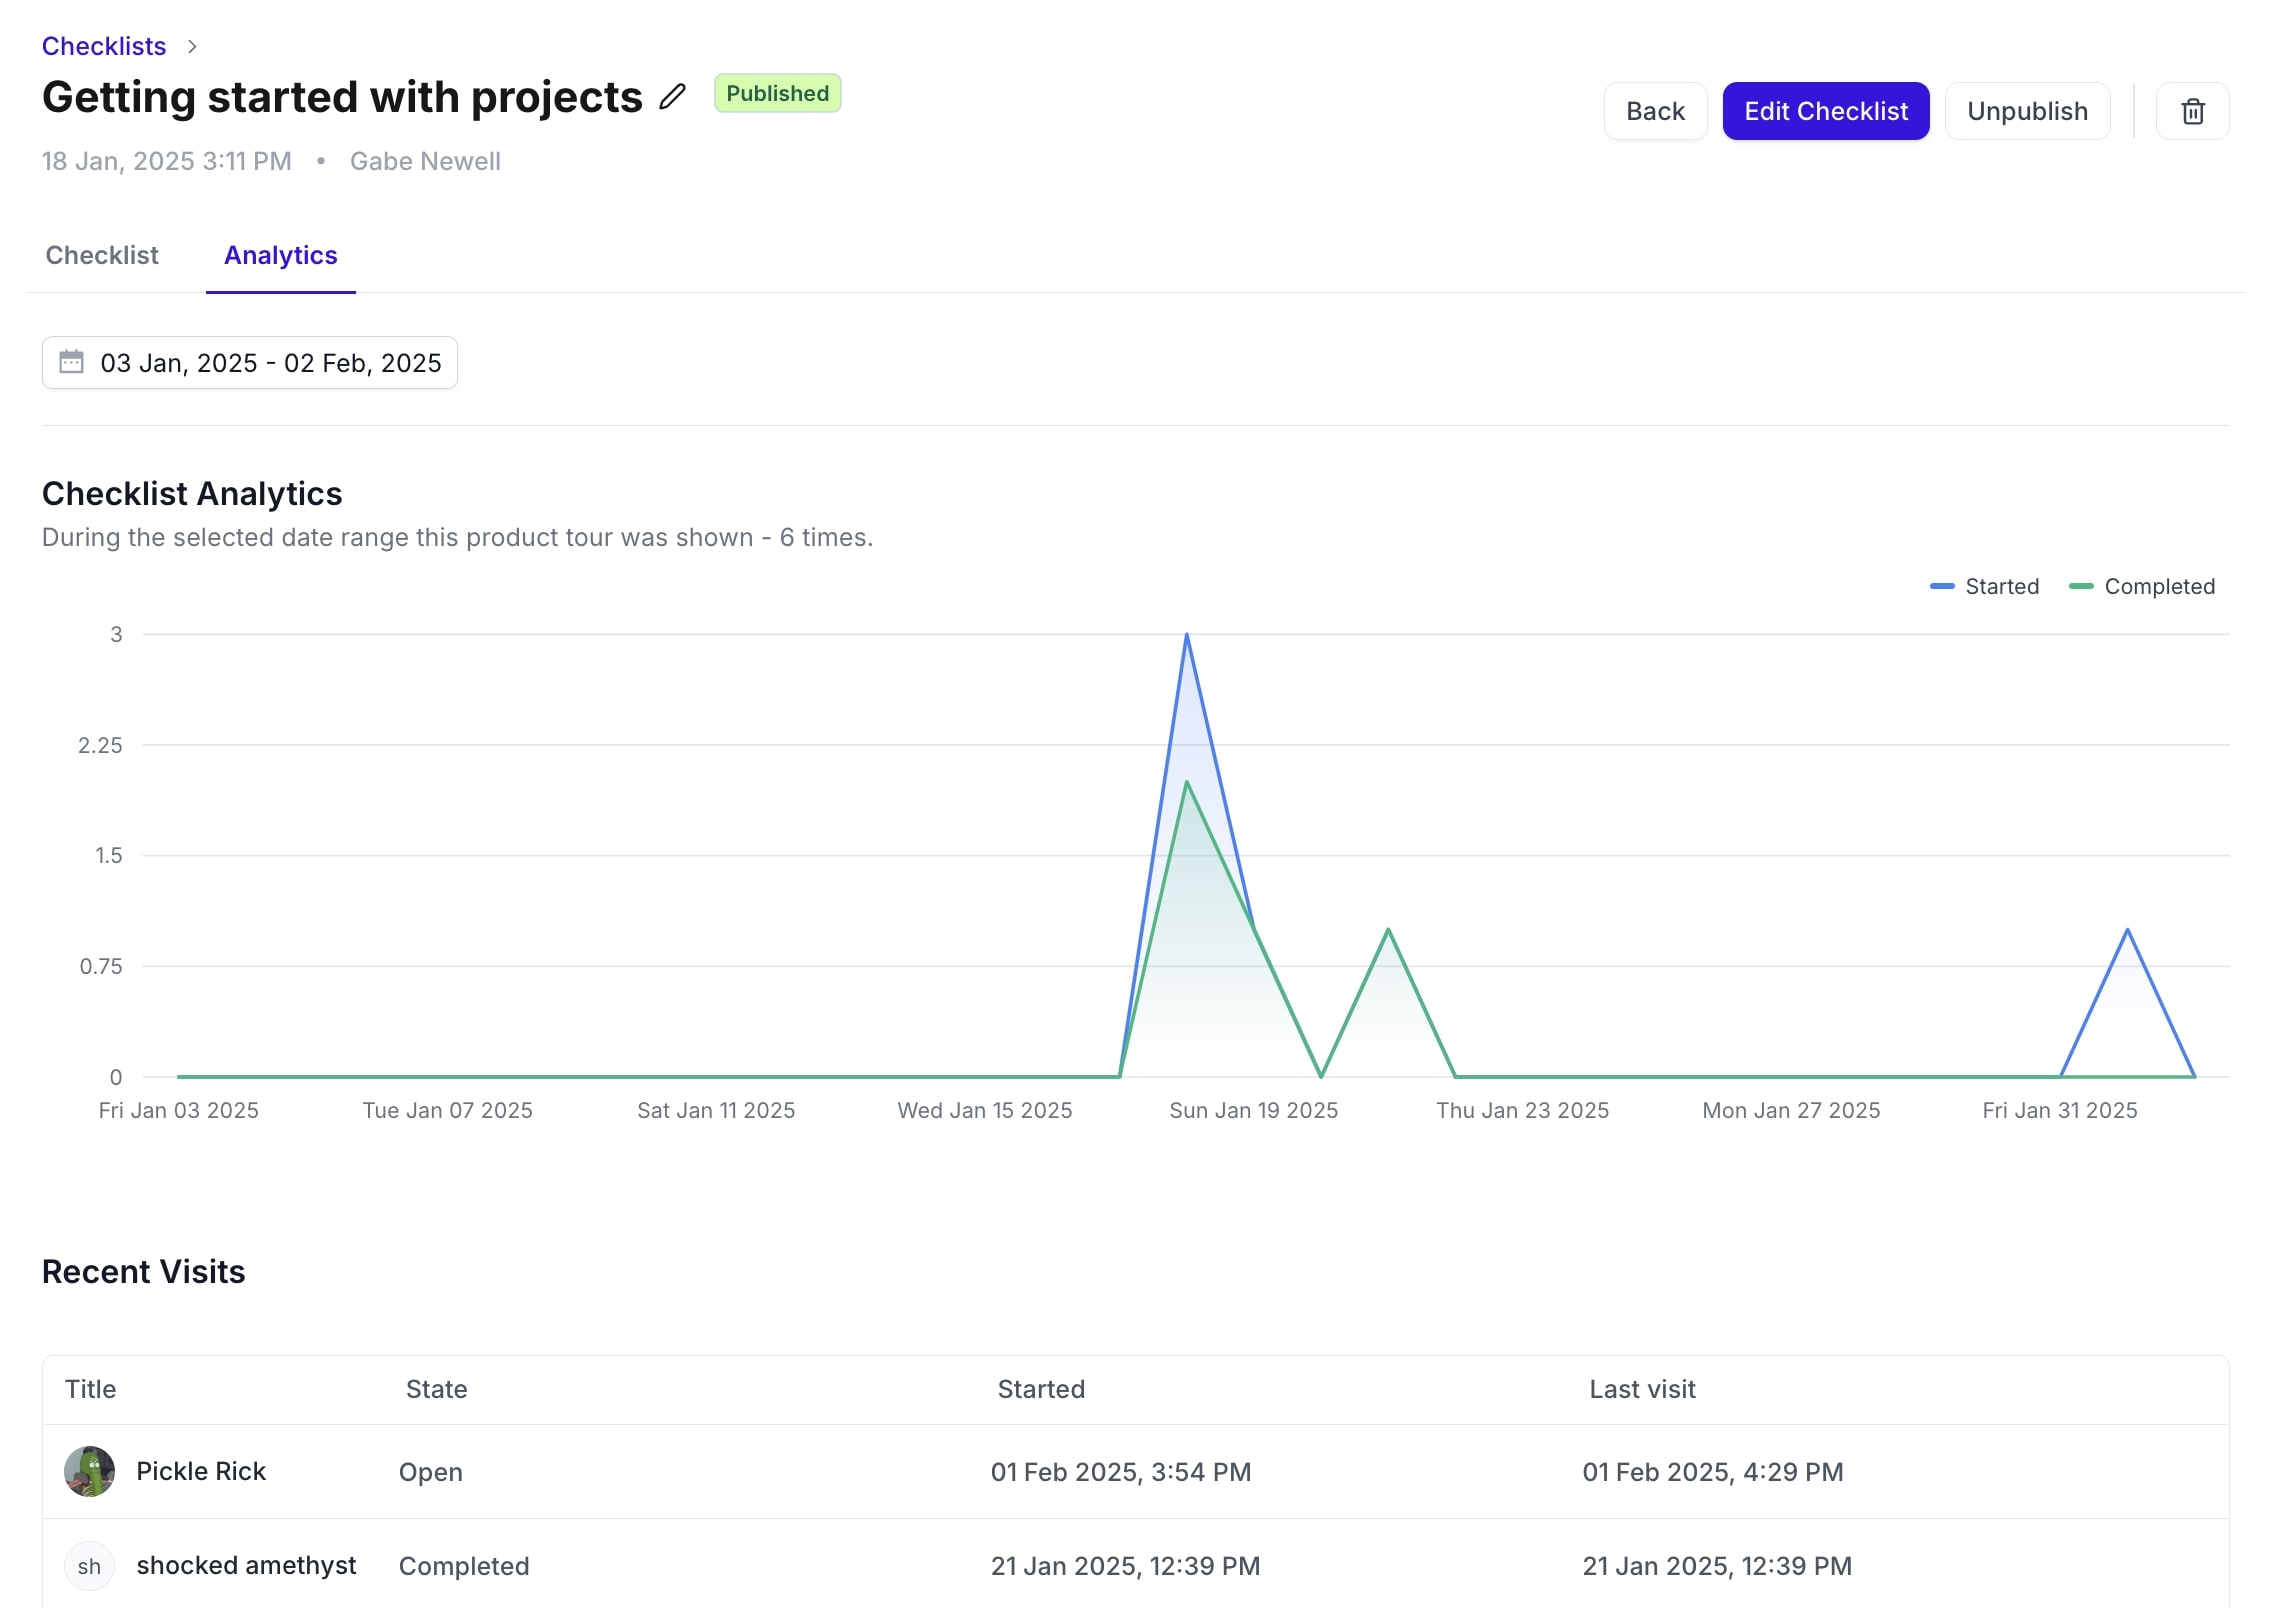
Understand User Journeys
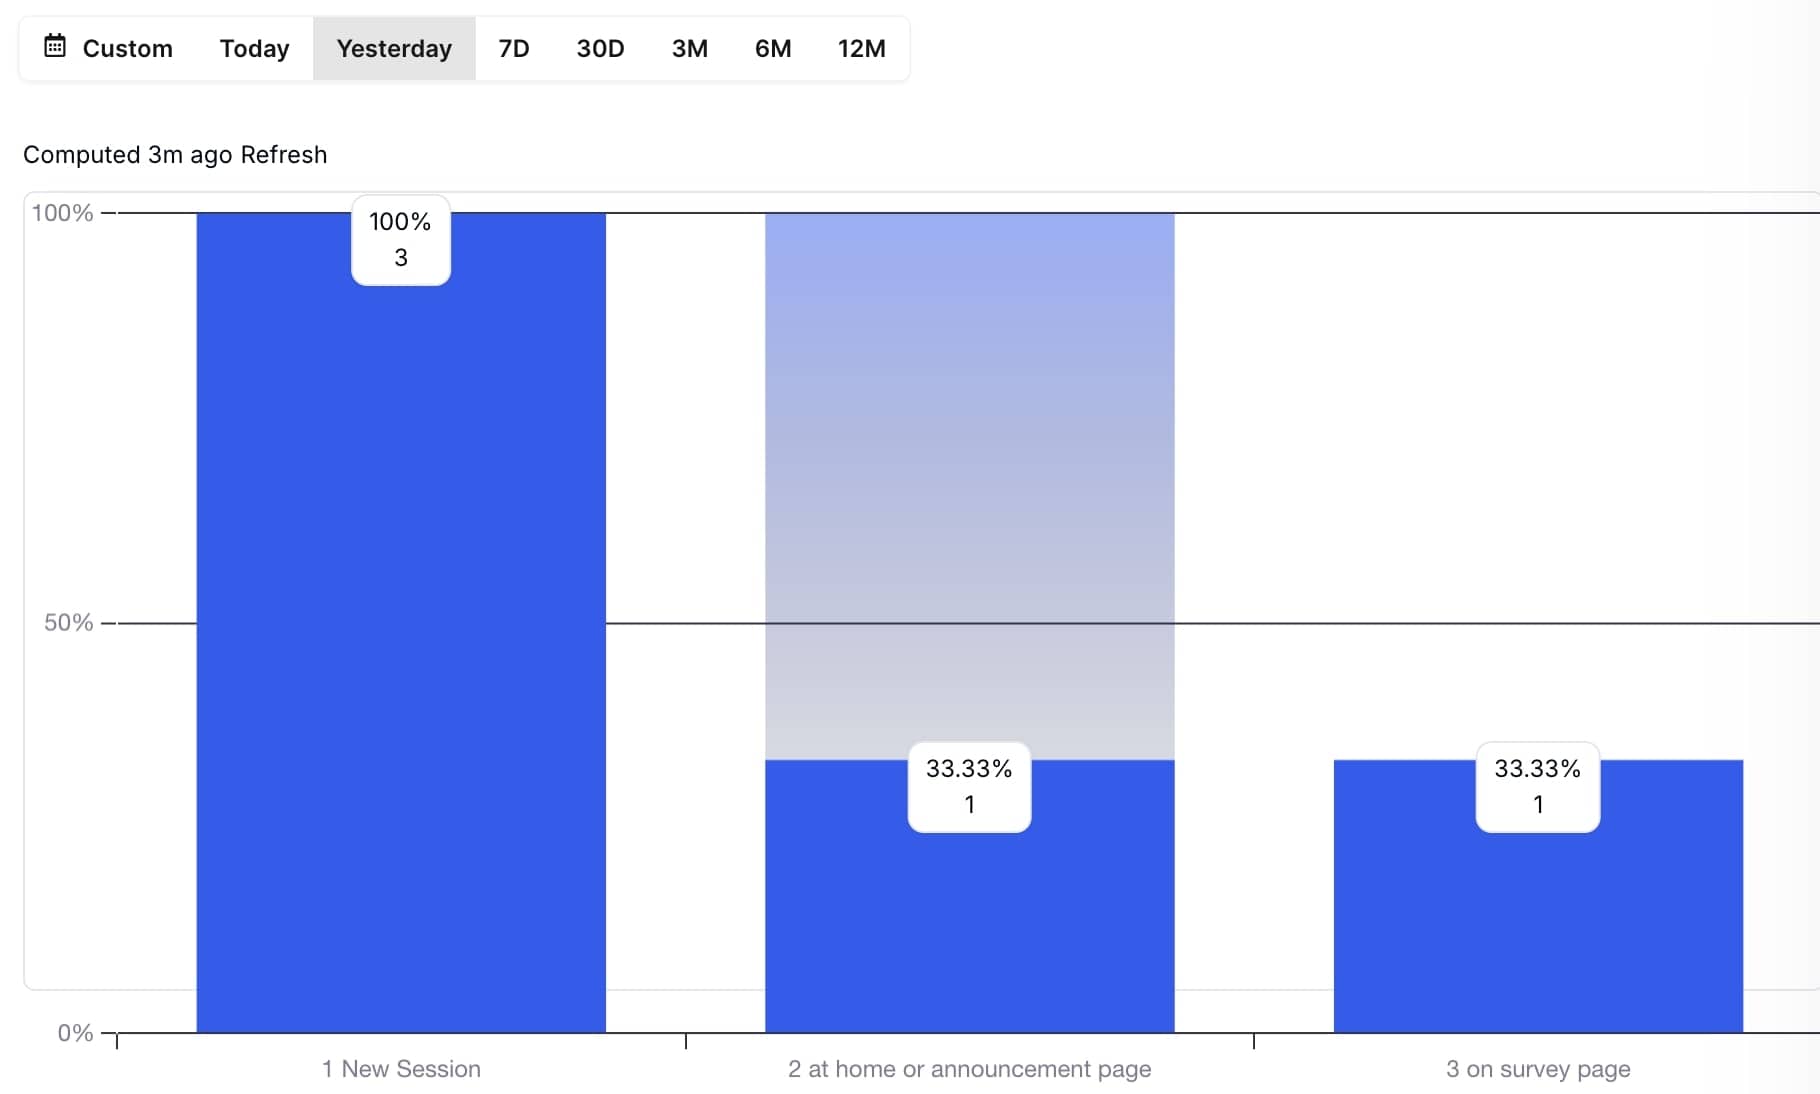
Explore user paths and build funnels to understand conversion and drop-off. Compare conversion trends and time to convert, then use those findings to improve onboarding.
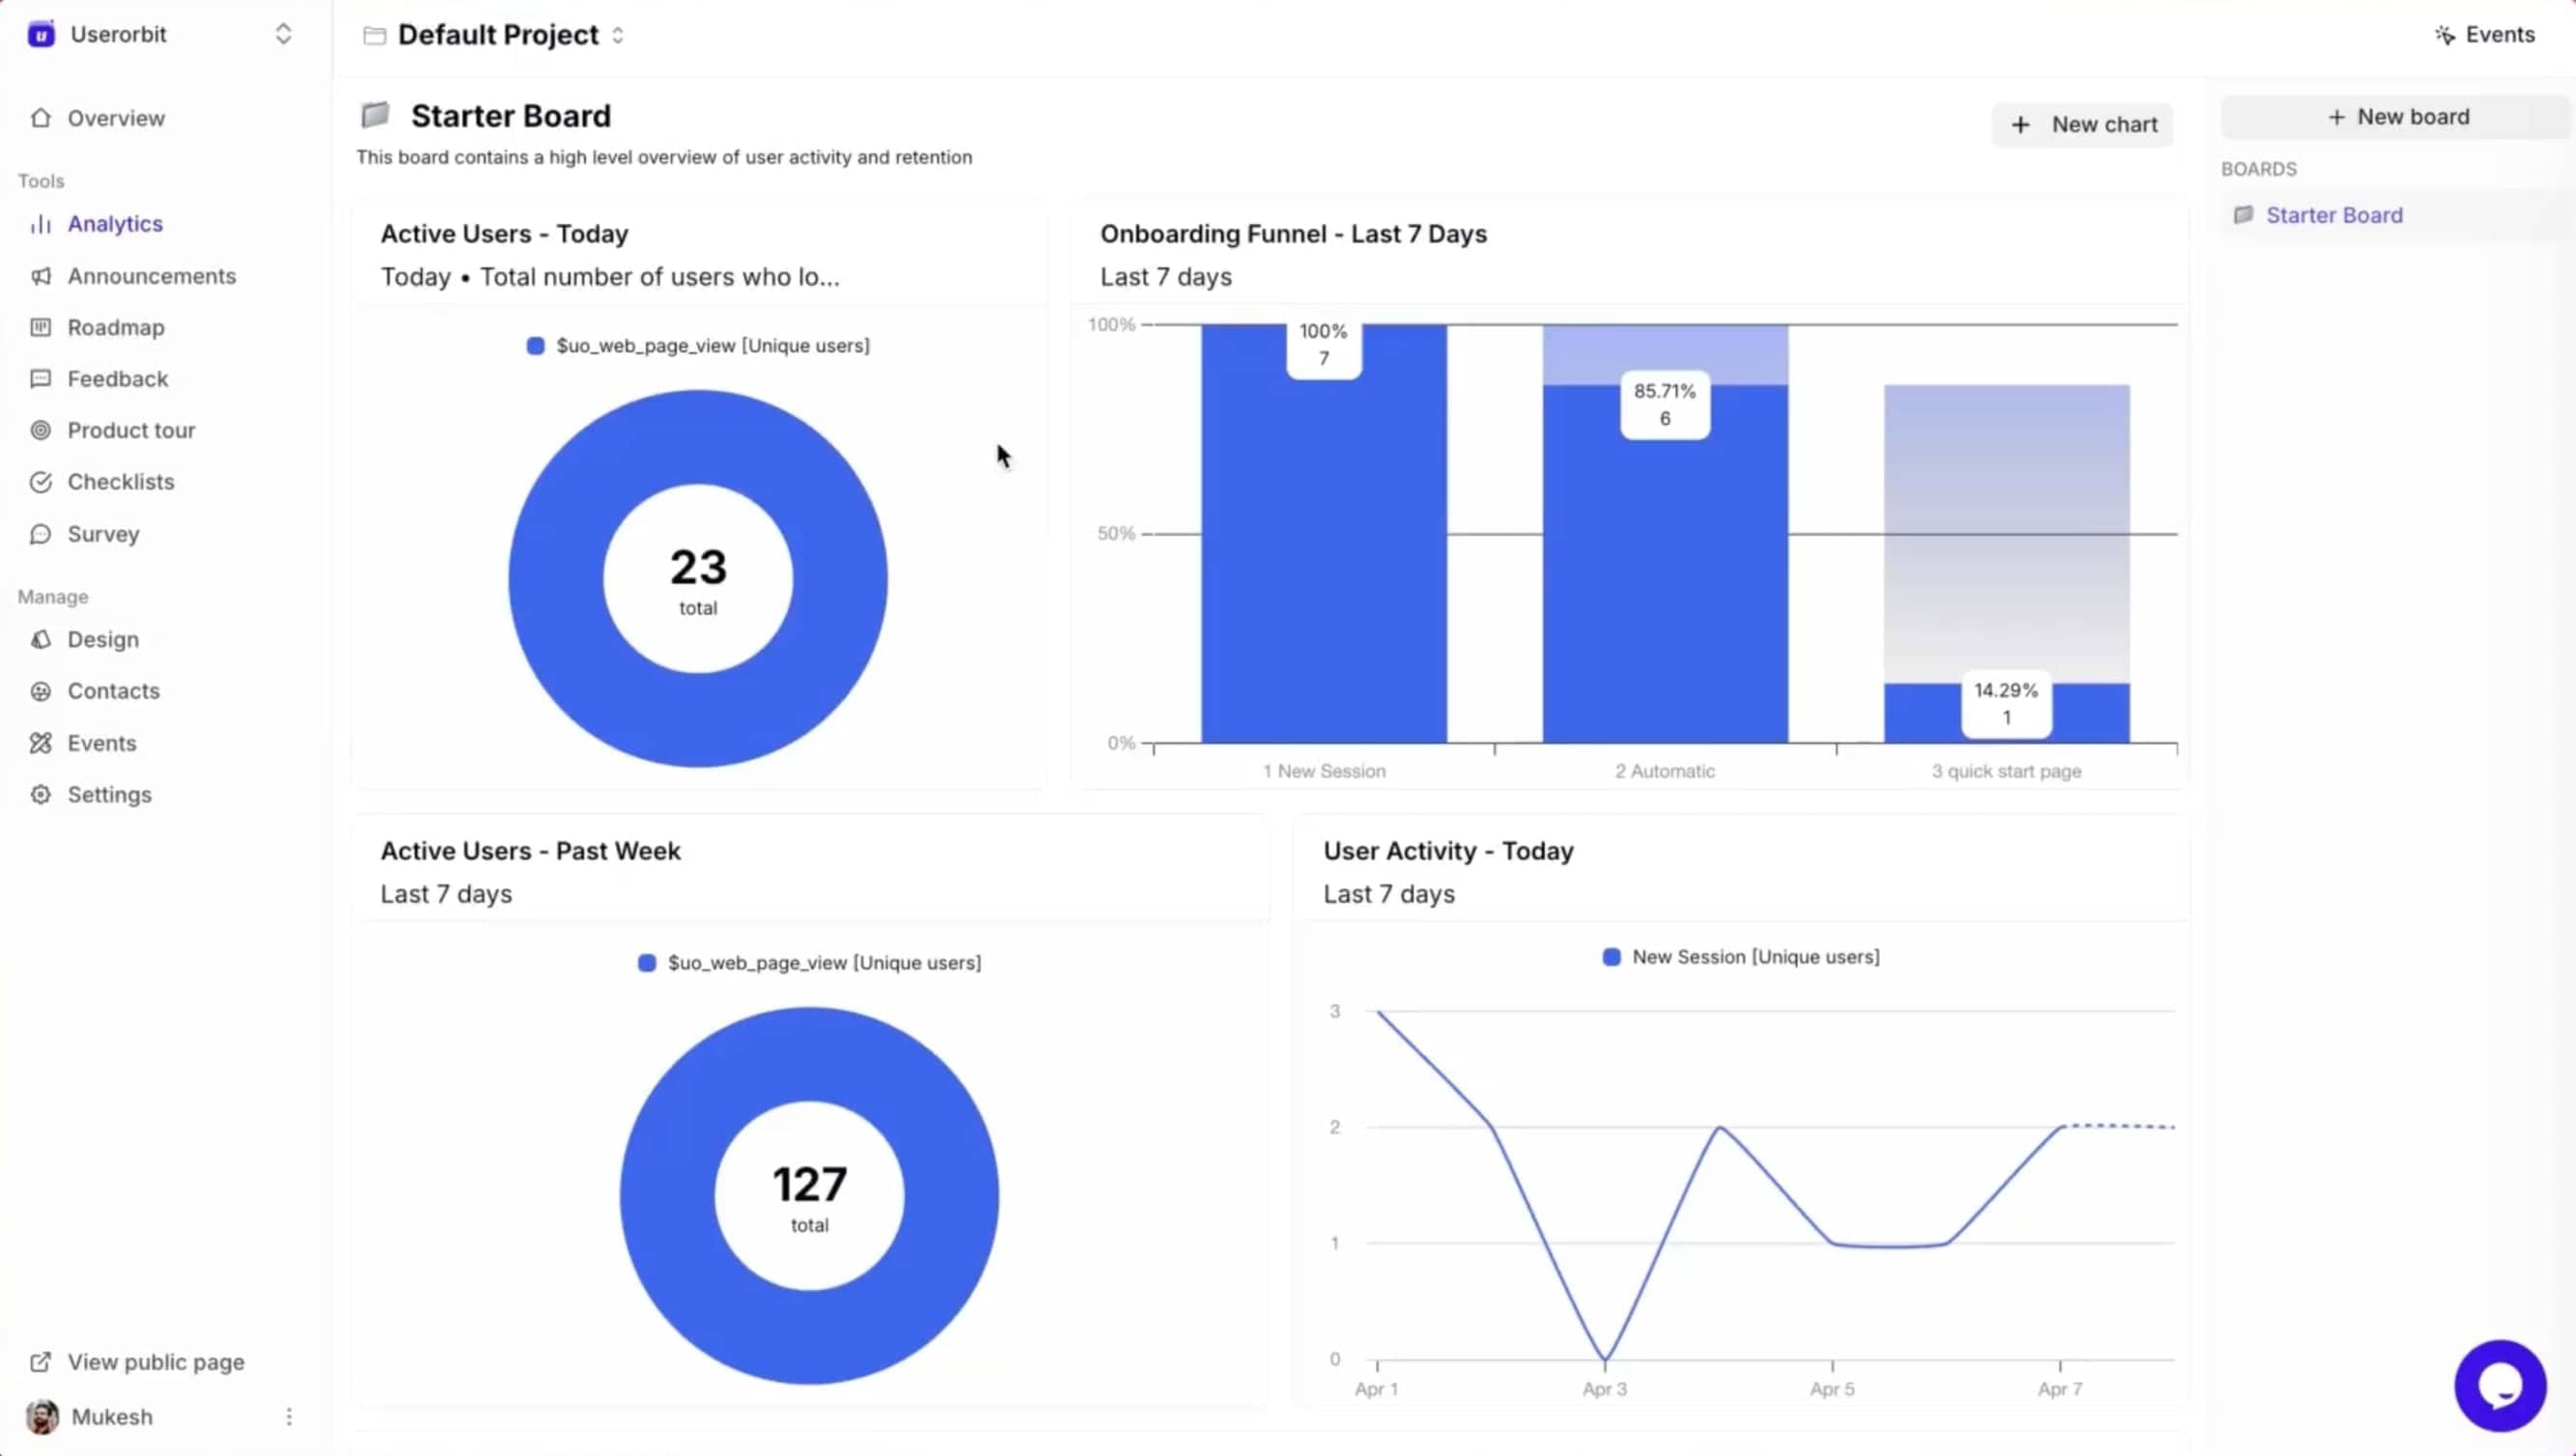
Real-Time Dashboards & Reports
Build dashboards around your key reports. Schedule daily, weekly, or monthly email snapshots to your own Userorbit account to keep track of changes.
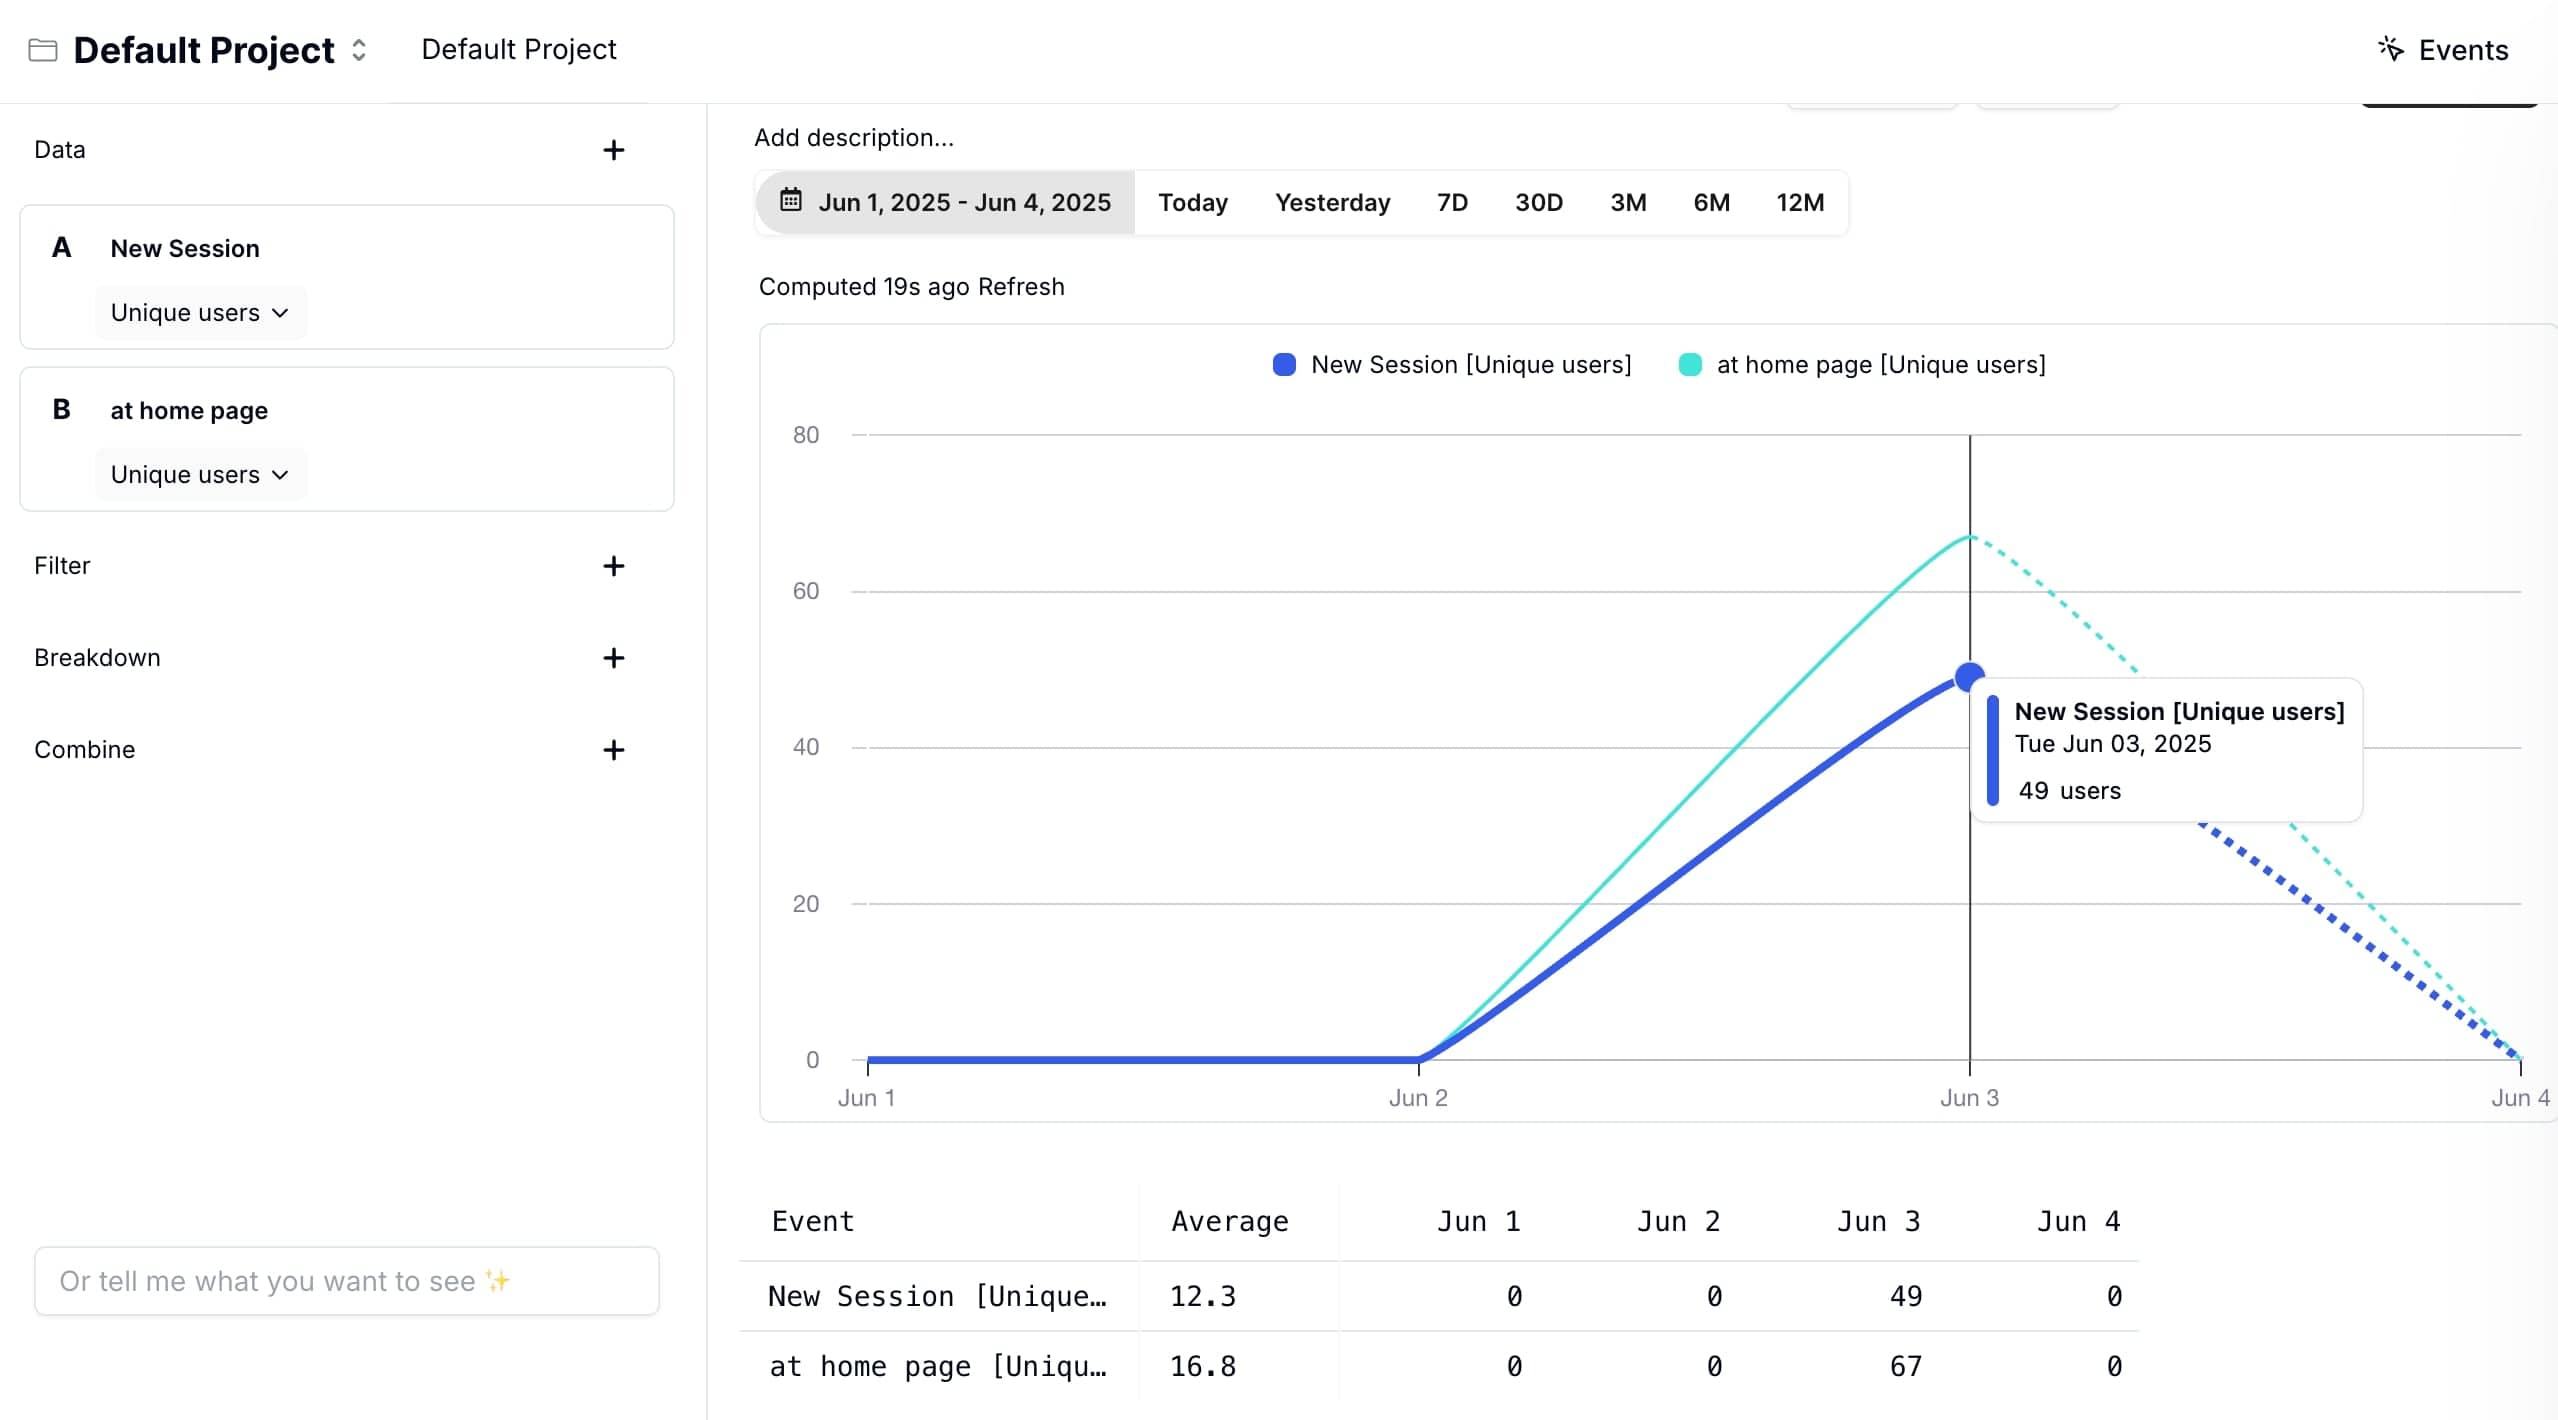
Cohort & Segmentation Analysis
Segment users by cohort, role, or plan. Uncover patterns and optimize experiences for every audience with powerful filtering.
Session replay: watch the user experience behind the numbers
Userorbit includes session replay for watching recorded user sessions. Use analytics to find patterns in adoption and conversion, then review user recordings to understand confusing interactions and friction.
Explore session replay and user recordingsAdvanced analytics for product teams
Comprehensive Analytics
Track every key metric: feature usage, retention, engagement, and more. Get a 360° view of your product's performance.
Custom Dashboards
Build dashboards tailored to your team's needs. Visualize trends, segment data, and monitor what matters most.
Revenue & Lifetime Value
Use lifetime-value (LTV) reports to understand revenue over time from the revenue events you track.
Cohort & Segmentation
Segment users by cohort, role, or plan. Uncover patterns and optimize experiences for every audience.
Stickiness Analysis
Measure how often users return to perform an event across days, weeks, or months. Find the behaviors that become repeat habits.
Journey Mapping
Visualize the entire user journey. Identify drop-offs, bottlenecks, and opportunities for growth.
Powerful Filtering
Drill down into your data with advanced filters. Find exactly what you need, fast.
Lifecycle Reports
Compare new, returning, resurrected (reactivated), and dormant users. See how your active audience changes over time.
Scheduled Analytics Emails
Schedule a summarized dashboard snapshot to your own account email every day, week, or month.
Does Userorbit include session replay?
Yes. Userorbit includes session replay to watch recorded user sessions, alongside product analytics for feature adoption, funnels, retention, and user journeys.
What is Product Analytics?
Product Analytics helps you understand how users interact with your product, track feature adoption, and make data-driven decisions to improve user experience.
What kind of insights can I get from analytics?
You can track user engagement, feature usage, onboarding drop-offs, retention trends, and more. Analytics dashboards provide actionable insights for product and growth teams.
Can I segment analytics by user cohorts?
Yes, segment your analytics by user cohorts, roles, plans, or custom attributes to uncover deeper insights and optimize for different user journeys.
How does analytics help with product improvement?
Analytics highlight which features are loved, ignored, or need improvement. Use this data to prioritize your roadmap and deliver more value to your users.
Unlock actionable insights into user behavior
Track feature adoption, understand user journeys, and review session recordings. Start a 14-day free trial.