
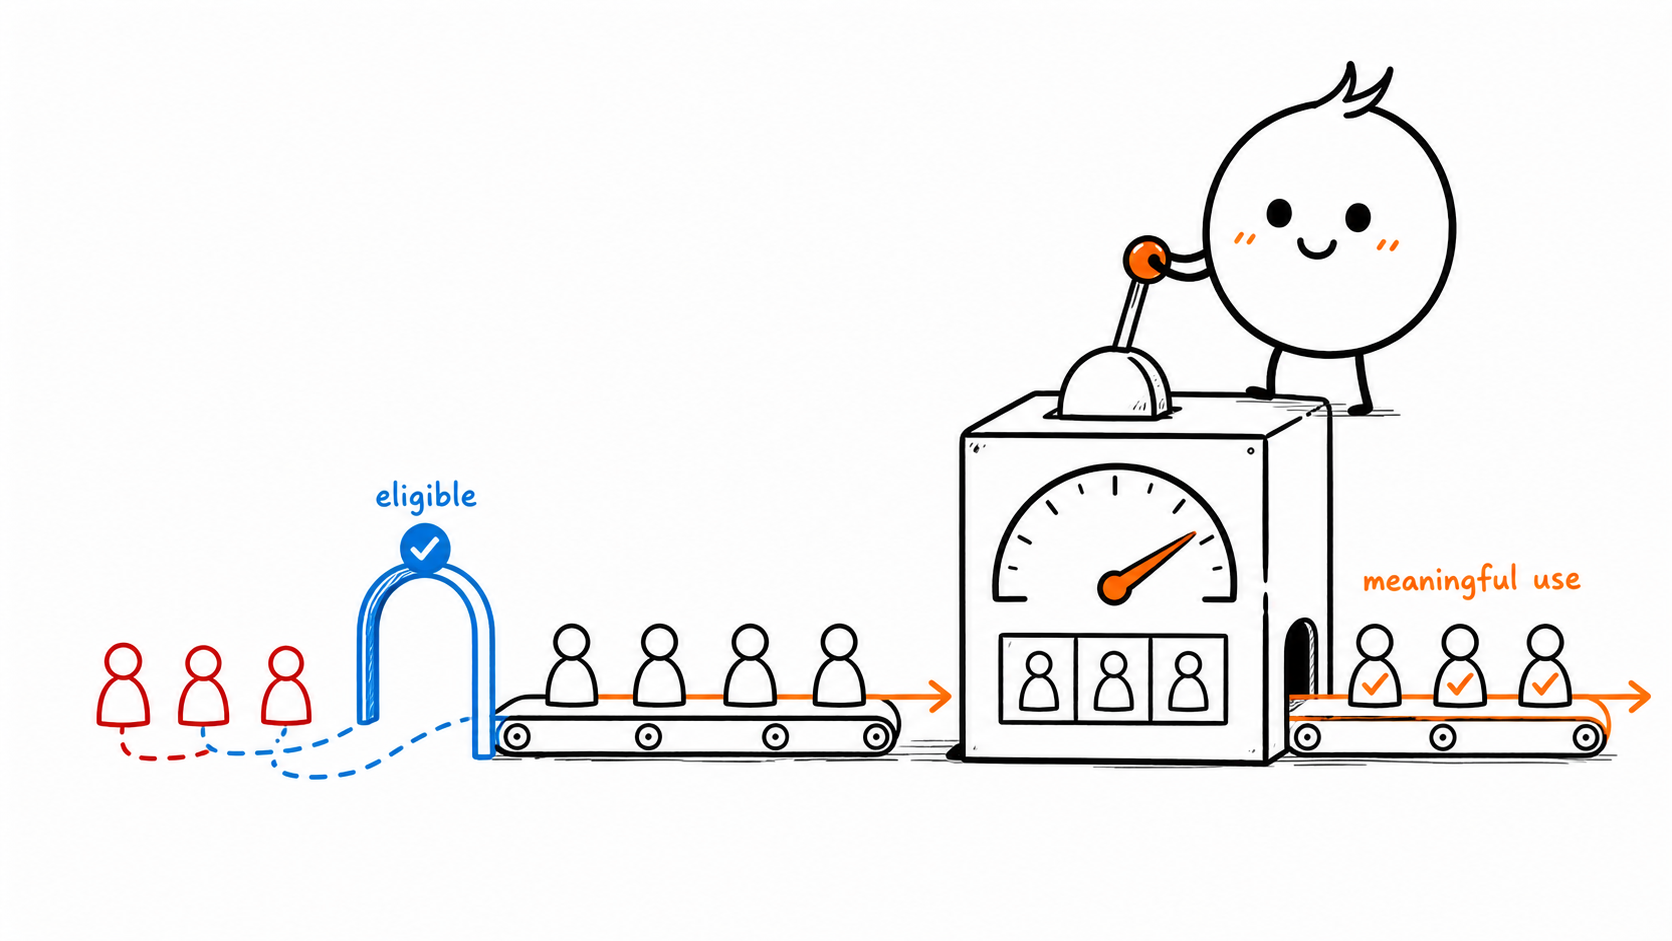








Feature adoption rate looks like one percentage. It is really four decisions: who could adopt, what counts as adoption, which entity you are counting, and how long they have to act.
The basic formula is:
Feature adoption rate = distinct eligible users or accounts that reach meaningful use ÷ distinct eligible users or accounts in the same window × 100
Contentsquare publishes the same basic numerator-and-denominator structure for adoption breadth. Using an explicitly eligible population is our recommendation for products where access and relevance vary by plan, role, permission, or opportunity.
For most recurring SaaS features, use active eligible users or accounts as the denominator. Do not divide by your entire user base when the feature is limited by plan, permission, role, beta access, or a use case that only occurs occasionally.
Then put the definition beside the result. “Reporting export adoption · eligible active account admins · completed scheduled export · 30 days” can guide a decision. “Feature adoption: 31%” cannot.
What feature adoption rate actually measures
Feature adoption rate measures the breadth of qualifying use across a defined population. It does not measure event volume, time spent, satisfaction, revenue impact, or whether the feature caused retention.
The qualifying behavior should show that the user received the feature's intended value. Opening a report builder is discovery. Saving and successfully delivering a scheduled report might be meaningful use. The threshold will be different for a one-time integration, a daily editor, and an annual compliance workflow.
Pendo's feature-adoption framework separates breadth, depth, time to adopt, and duration. That is a useful reminder that one percentage cannot describe the full result. Treat it as a vendor framework, not a universal benchmark.
These adjacent metrics answer different questions:
| Metric | What it tells you | What it does not tell you |
|---|---|---|
| Feature usage | How many interactions, users, or events a feature received | Whether those interactions created value |
| Feature adoption | Which eligible entities crossed a meaningful-use threshold | How intensely they use it or what business result followed |
| Activation | Which new users or accounts reached the product's first value milestone | Whether an existing customer adopted a later feature |
| Engagement | How broadly, deeply, or frequently people interact | Whether the activity is useful |
| Retention | Whether a starting cohort returns for a defined action later | Why they returned or whether the feature caused it |
| Product adoption | Whether customers incorporate the product's core value into their work | Whether they adopted a particular capability |
Amplitude defines retention as return over time and stickiness as the number of days or weeks a user performs an event. If your immediate question is whether new signups reached first value, measure activation rate instead.
Choose the denominator before you calculate the rate
There is no denominator that works for every product question. Report the active-eligible rate as the operating default, then use the other two views when they clarify reach or conversion.
| Denominator | Formula | Use it to decide |
|---|---|---|
| Entitled population | Adopters ÷ everyone with access | How far the feature has spread across the population you could eventually serve |
| Active eligible | Adopters ÷ eligible entities active in the relevant product or workflow | Whether current users with a plausible need are adopting; the best default for most recurring features |
| Opportunity or exposure | Adopters ÷ eligible entities that encountered the use case or feature entry point | Whether discovery, education, or first-use friction is blocking adoption |
“Active” must fit the feature. A login is a reasonable activity rule for a core navigation feature. It is too broad for an invoice-close workflow that only finance admins use once a month.
Exposure also needs care. Targeting a user or evaluating a feature flag does not prove the entry point appeared on screen. LaunchDarkly separates flag evaluation exposures from later metric events and recommends evaluating at the moment the user encounters the experience. For adoption reporting, instrument the rendered entry point or the actual workflow opportunity when you can.
Measure the whole path, not only the final percentage
A headline adoption rate tells you the size of the gap. This seven-stage model tells you where to investigate it.
| Stage | Count an entity when… | Diagnostic rate |
|---|---|---|
| Eligible | It has the plan, role, permission, flag, and version required for access | Starting population |
| Exposed | The entry point, announcement, prompt, or relevant workflow is actually encountered | Exposed ÷ eligible active |
| Discovered | The user intentionally opens or inspects the feature | Discovered ÷ exposed |
| First use | The user completes the smallest successful feature action | First users ÷ discovered |
| Meaningful use | The user or account completes the action or sequence that delivers intended value | Meaningful adopters ÷ eligible active |
| Repeat use | The adopter completes meaningful use again at the expected cadence | Repeat users ÷ meaningful-use cohort |
| Retained use | The adopter returns in a later comparable interval | Retained adopters ÷ original adoption cohort |
The meaningful-use rate is the headline feature adoption rate. Keep the other stages visible because they produce different responses.
Pair breadth with four companion measures:
- Frequency: the median number of meaningful uses per adopter in the feature's natural period.
- Depth: the amount of the valuable workflow each adopter completes, such as successful outputs, objects managed, or advanced steps reached.
- Time to adopt:
first meaningful-use timestamp − first eligible or first exposed timestamp. Eligibility-to-adopt measures rollout latency; exposure-to-adopt focuses on discovery and setup. Pick one anchor and name it. - Duration: the share of an adoption cohort that continues meaningful use in later comparable periods.
Read the stage losses this way:
- Low exposure calls for a rollout, targeting, or placement check.
- Strong exposure but weak discovery calls for clearer relevance or messaging.
- Strong discovery but weak first use points toward setup or usability friction.
- Strong first use but weak repeat use questions the recurring value or chosen cadence.
Do not jump from low adoption to “we need a product tour.” The stage loss should choose the response. If users discover the feature and fail during setup, more announcements will send more people into the same failure.
A worked feature adoption example
The following data is hypothetical. It shows why a single rate needs a funnel and an account view.
A B2B reporting product measures a scheduled-export feature over 30 days:
- 180 eligible active accounts contain 600 eligible active users.
- 450 users see the feature entry point.
- 310 open the feature.
- 186 complete a first successful export.
- 150 schedule an export that delivers successfully. This is meaningful use.
- 104 of those adopters repeat the workflow during the window.
- 82 of the original adopters return in the next comparable period.
- 96 accounts meet the account-adoption rule.
The calculations are:
| Metric | Calculation | Result |
|---|---|---|
| Exposure rate | 450 ÷ 600 | 75.0% |
| Discovery after exposure | 310 ÷ 450 | 68.9% |
| First-use conversion | 186 ÷ 310 | 60.0% |
| Meaningful completion after first use | 150 ÷ 186 | 80.6% |
| User feature adoption rate | 150 ÷ 600 | 25.0% |
| Repeat rate among adopters | 104 ÷ 150 | 69.3% |
| Next-period retained adoption | 82 ÷ 150 | 54.7% |
| Account adoption rate | 96 ÷ 180 | 53.3% |
Account adoption is more than twice user adoption. That does not prove the rollout is healthy or weak. It suggests many accounts have at least one adopter while usage across eligible seats is narrower.
If one finance admin is supposed to own scheduled exports, that may be the intended pattern. If analysts throughout the account should schedule their own reports, add seat breadth inside adopting accounts:
Eligible users who adopted inside adopting accounts ÷ eligible users in those accounts × 100
Instrument the measurement contract
Write the metric definition before asking engineering to add events. Snowplow's current tracking-design guidance starts with the business events, decisions, trigger conditions, and context the analysis needs. Amplitude similarly recommends choosing events from the questions you need to answer, rather than tracking every interaction.
For a typical feature, instrument stable equivalents of:
feature_entry_point_viewedfeature_openedfeature_action_startedfeature_action_completedfeature_outcome_delivered
Use your existing naming convention. A specific event such as scheduled_export_delivered is more trustworthy than a generic button_clicked event. Derive repeat and retained use from another occurrence of the meaningful event instead of emitting a separate “repeat” event.
Attach the context required to rebuild eligibility and segments:
- Stable user and account or workspace IDs
- Role and permission state
- Plan and feature entitlement
- Beta or release cohort
- Stable feature key and product area
- Entry surface or campaign source
- Application or release version
- Success, failure, and error class
- Workflow or object ID for deduplication
- A consistent timestamp and timezone policy
Snapshot changing properties on the event when they affect interpretation. If an account upgrades in August, its July events should not appear as though the feature was available then.
Before trusting the dashboard, verify identity, exclude staff and test workspaces, test plan and permission filters, deduplicate retries, and reconcile the meaningful outcome with a server-side record where practical. Name and version the metric so a changed workflow does not silently rewrite the trend.
Handle B2B adoption at the right level
B2B features expose the weakness in user-only measurement. The buyer is often an account, access differs by role, and value can require several people.
| B2B condition | Measurement rule |
|---|---|
| Seats versus accounts | Report user adoption and account adoption together; add seat breadth when shared usage matters. |
| Roles and permissions | Include only people who can perform the meaningful action. Do not let viewers depress an admin-only rate. |
| Team workflows | Define an account sequence that can be completed by different members rather than requiring one user to perform every step. |
| Plan-gated features | Snapshot entitlement and compare only accounts or users with access during the window. |
| Beta cohorts | Keep beta, phased rollout, and general-availability cohorts separate. |
| Low-frequency value | Use a longer window or divide by accounts that faced the relevant opportunity; emphasize success and time to complete. |
| Seasonality | Compare matched cycles or year-over-year periods when history allows; annotate known seasonal effects. |
Amplitude's account-level reporting documentation explains why this matters: group analysis can count an account-level funnel even when different members complete different steps. Use that model for collaborative workflows, whether you implement it in a product analytics platform or in your warehouse.
For a quarterly security review or a disaster-recovery feature, weekly repeat use would punish the product for working as intended. Measure eligible opportunities, successful outcomes, failure rate, and time to complete. Report that the opportunity denominator is estimated if the need cannot be observed directly.
Build a dashboard that preserves the definition
The dashboard should help a skeptical operator understand both the number and its limits.
- Definition bar: entity, eligibility, meaningful-use rule, window, cadence, data freshness, and metric version.
- Headline row: active-eligible user adoption, account adoption, repeat adoption, retained adoption, and median time-to-adopt.
- Stage funnel: eligible through repeat use, with counts as well as percentages.
- Cohort view: retained feature use by first meaningful-use cohort at the natural cadence.
- Breakdowns and exceptions: plan, role, account tier or size, beta/release cohort, source, high-value non-adopters, and champion-only accounts.
Add quality guardrails beside adoption: outcome success rate, errors, time to complete, support contacts, and dismissals or opt-outs. A higher adoption rate paired with more failures is not a clean win.
Amplitude's retention analysis uses a starting event, a return event, and daily, weekly, or monthly usage intervals. Apply the same discipline here: cohort by first meaningful use, choose an interval that matches the feature, and keep same-period repeat use separate from next-period retention.
Set a baseline before you set a target
There is no credible universal adoption target for all features. A mature core workflow, a new beta, an admin control, and an annual export should not share a benchmark.
Use this sequence instead:
- Freeze the definition and validate the instrumentation.
- Establish a baseline from comparable cohorts and matched periods.
- Split only by segments that could change the product decision.
- Find the largest controllable stage loss.
- Set a target for that stage plus a quality guardrail.
- Recheck repeat and retained use after launch novelty fades.
Pendo recommends using historical data and positive customer outcomes because healthy usage goals are unique to each business. That is vendor guidance, but it is a more defensible starting point than copying a percentage from a product with a different audience and cadence.
Avoid the failure modes that inflate adoption
Audit the metric if any of these are true:
- The denominator includes users without access, permission, or a plausible need.
- The numerator counts page views, clicks, or total events instead of distinct meaningful adopters.
- The chart uses “ever used” and cannot show decay.
- Launch cohorts and mature steady-state users are mixed.
- Assignment or targeting is counted as exposure.
- Users and accounts appear in the same formula.
- One champion is treated as full account adoption without checking seat breadth.
- A multi-role workflow requires one person to complete every step.
- Plan, role, beta, or application-version changes are missing.
- Event retries, anonymous identity splits, staff, bots, or test data inflate the count.
- The definition changed without a new metric version.
- Segment percentages appear without sample counts.
- Correlation with retention is described as causal impact.
The last mistake is common. Retained accounts may adopt more features because they are healthier and more motivated. Observational data alone cannot tell you whether the feature caused retention.
Turn the measurement into a product action
You can implement the first useful version in one review cycle:
- Choose one important feature and write its entity, eligibility, meaningful-use event, and cadence.
- Instrument or validate eligibility, exposure, discovery, and meaningful outcome events.
- Build the active-eligible rate, stage funnel, account view, and first-use cohort.
- Review the largest stage loss with product, growth, and customer success.
- Launch one targeted response, then watch the next stage and its quality guardrail.
Use whatever analytics stack you trust. A warehouse or specialist platform is often the better fit for advanced account modeling, long historical joins, or causal analysis.
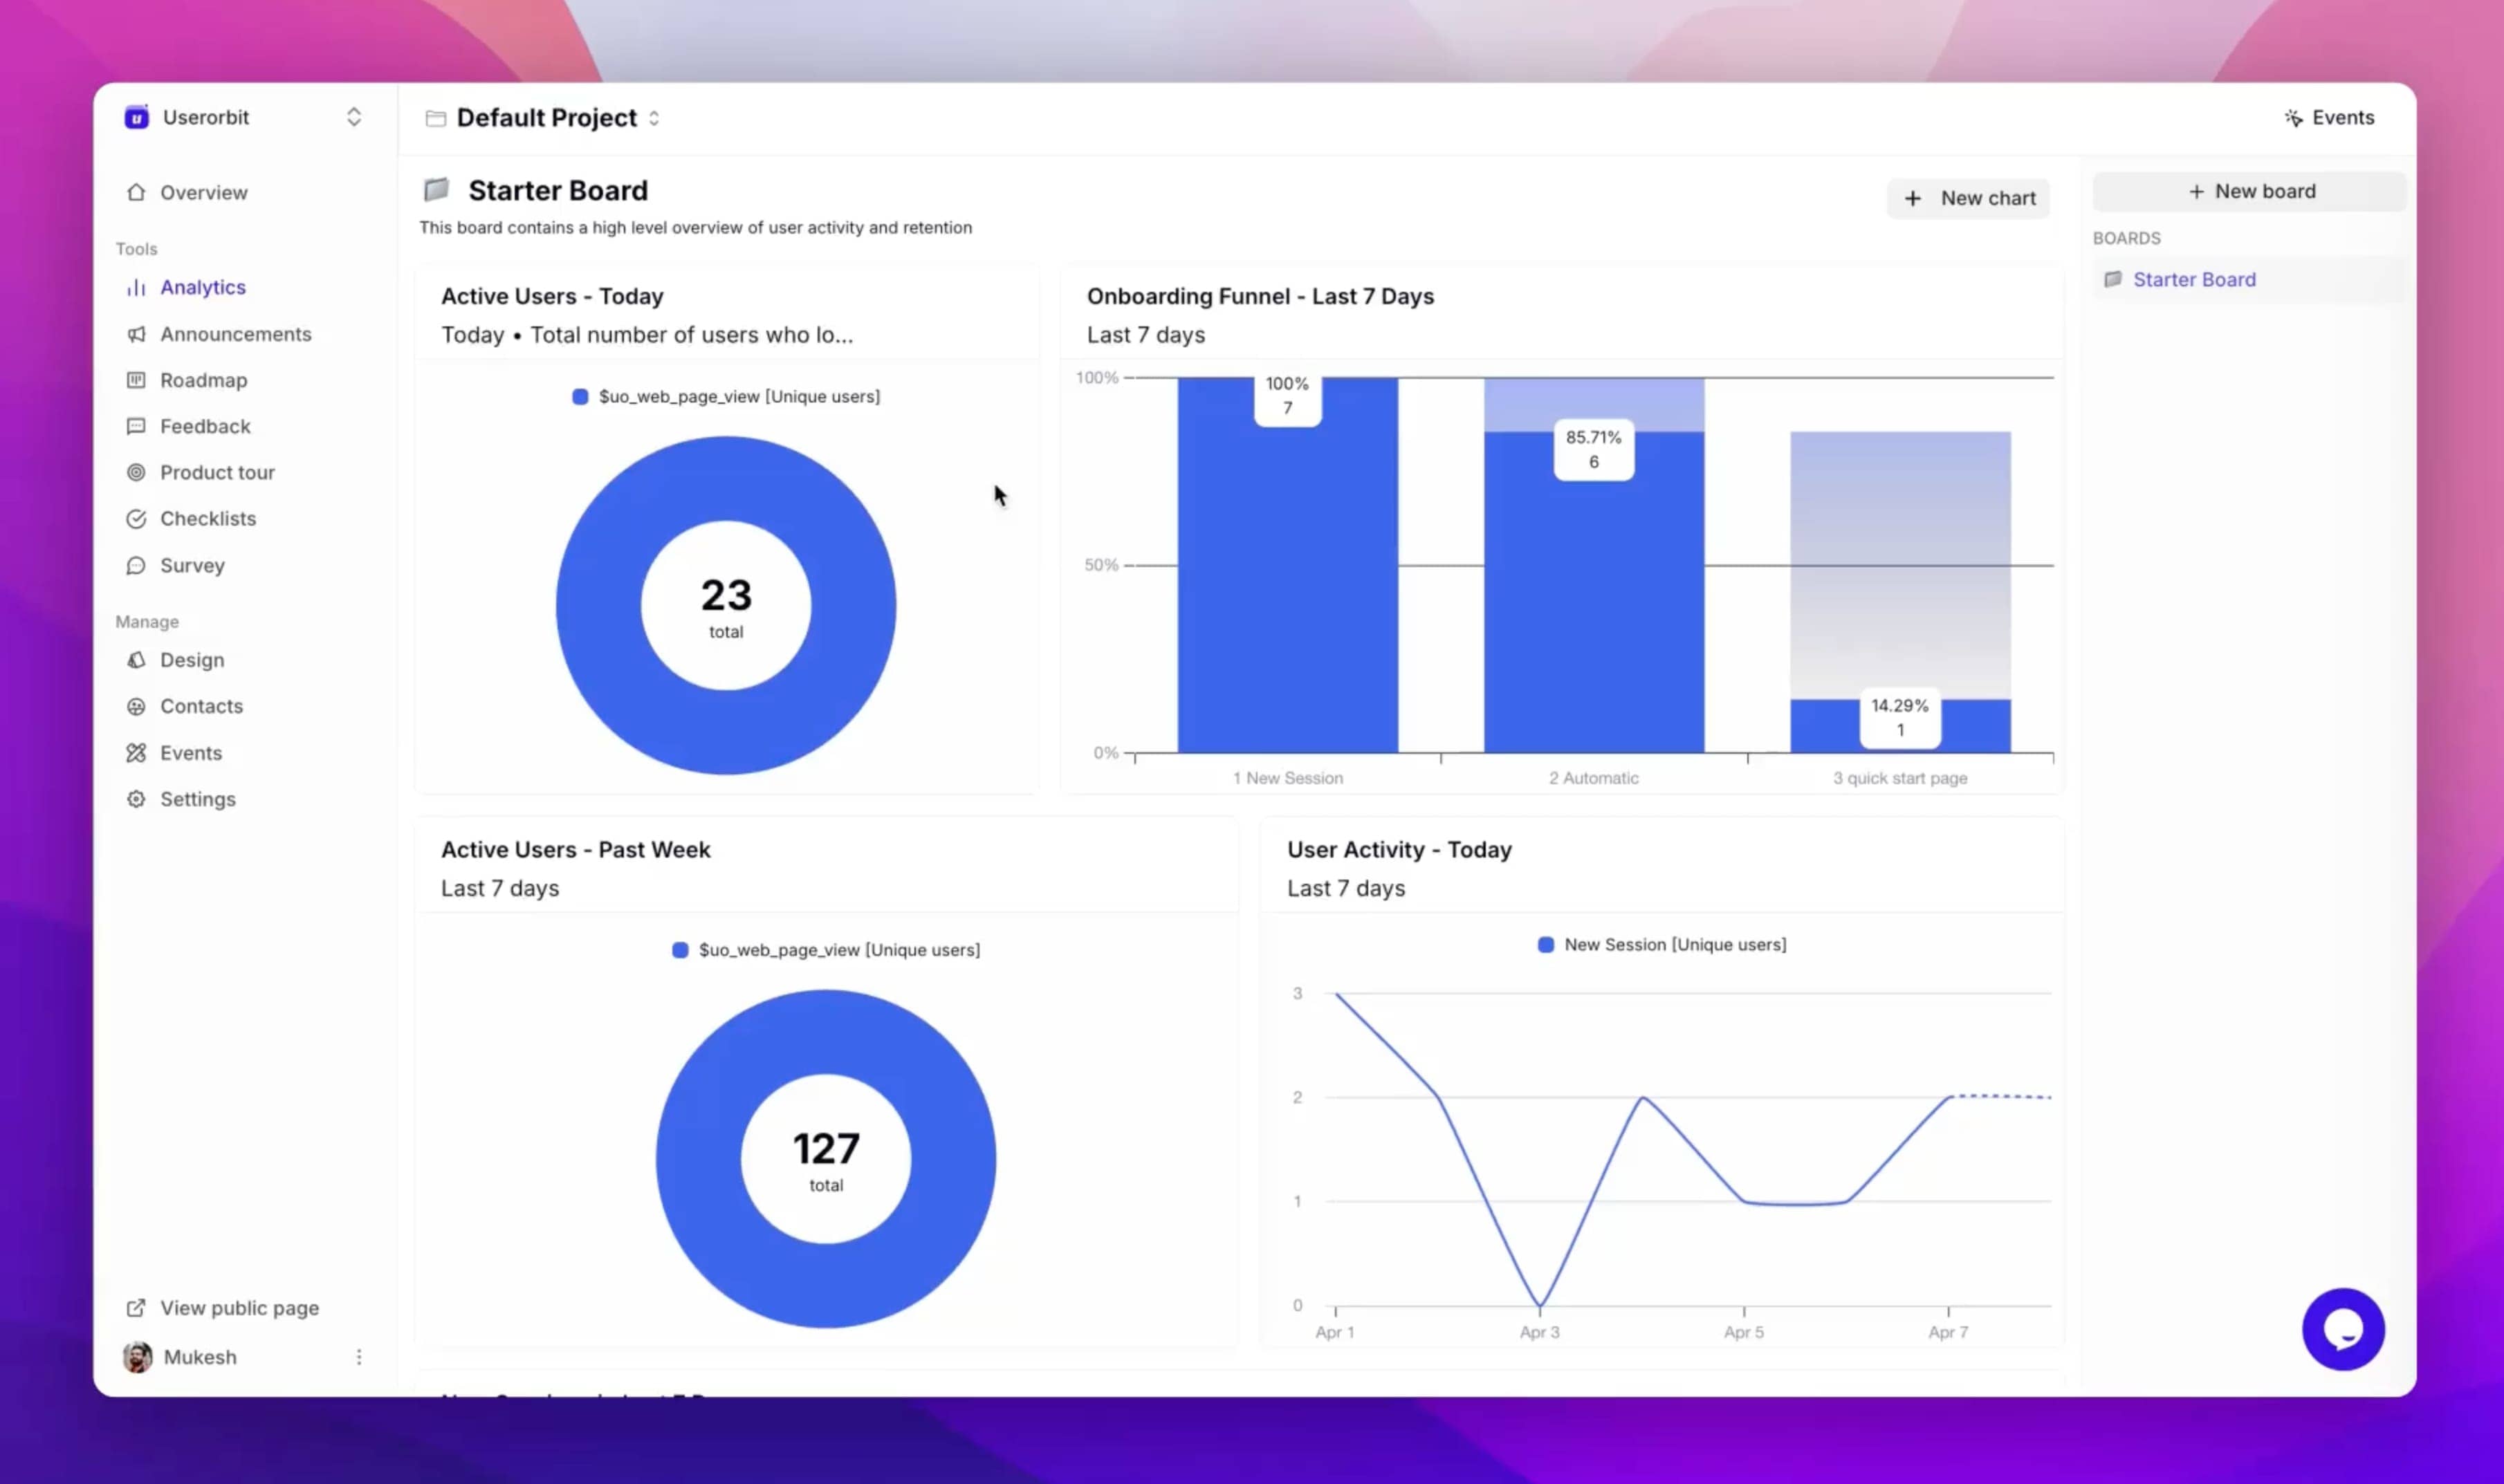
Userorbit is relevant when the next action should stay connected to the measurement. Its current public documentation covers unique-user and frequency insights, funnels and retention, and segments, cohorts, goals, dashboards, and custom metrics. Teams can then target announcements, tours, checklists, surveys, or feedback prompts from the same workspace.
When an interactive demo is the discovery step before live-product use, apply the same discipline with Interactive Demo Analytics: What to Track Beyond Views: define the demo event, the handoff, and the activation denominator before claiming that engagement influenced adoption.
The public docs do not clearly establish native distinct-account aggregation. If account adoption is central, verify that capability in your workspace or calculate the account metric in your warehouse or BI layer. Connected workflow is useful only when the underlying unit and denominator remain honest.
Feature adoption rate FAQ
Short answers for product, growth, and customer-success teams building an adoption measurement system.