


PostHog pricing is appealing for one reason: it feels fair. There are no seat-based surprises, no mandatory sales call to unlock a basic estimate, and no enterprise packaging before you even know if the product fits. You start free, track usage, and pay only when your product data volume grows.
That transparency is real. But the bill still gets complicated once you move beyond basic analytics.
A team that begins with a lightweight event setup can later add session replay, feature flags, experiments, warehouse syncs, and surveys. Each product has its own meter. Each meter scales differently. And because PostHog is built for highly instrumented product teams, usage tends to expand faster than people expect.
This guide breaks down how PostHog pricing works in 2026, where costs usually increase, what teams actually get for the money, and when it makes sense to choose an alternative.
Why PostHog Pricing Feels Different
Most product analytics vendors charge for seats, MTUs, or packaged plans that mix limits together. PostHog takes a different route. You pay by product usage.
That model has three immediate benefits:
- No per-seat tax: you can add engineers, PMs, growth teammates, and analysts without the bill jumping because more people logged in.
- Strong free tier: early-stage products can instrument a lot before paying anything.
- Cleaner unit economics: if your traffic is stable, your analytics bill is easier to reason about.
But there is a tradeoff. A usage-based platform is only predictable when your instrumentation is disciplined. If teams fire too many events, replay too much traffic, or enable new modules without guardrails, spend can grow quietly.
How PostHog Pricing Works
PostHog prices each product separately rather than bundling everything into one broad plan.
The main billing buckets are:
- Product analytics by event volume
- Session replay by recording volume
- Feature flags and experiments by requests or evaluated usage
- Data warehouse by rows synced or processed
- Surveys and feedback by responses
That means two companies with the same number of users can pay very different amounts.
A lean SaaS product with ten carefully chosen events and sampled replays may pay very little. Another team with aggressive autocapture, replay on every session, and multiple engineering environments can spend several times more at the same scale.
PostHog Free Tier: What You Get Before Paying
PostHog remains one of the better free starting points in this category. Here is what resets monthly at no cost:
| Feature | Free Monthly Limit |
|---|---|
| Product Analytics Events | 1,000,000 |
| Session Replays | 5,000 |
| Feature Flag Requests | 1,000,000 |
| Data Warehouse Rows | 1,000,000 |
| Batch Exports | 1,000,000 rows |
| Error Tracking Exceptions | 100,000 |
| Team Members | Unlimited |
| Projects | 1 project |
| Data Retention | 1 year |
| Support | Community forum |
Real context: 1M events monthly is roughly 33K events per day, which is enough for a startup tracking core features on 10K-50K monthly active users.
For small teams, the free tier is enough to:
- instrument core product events
- explore funnels and retention
- test feature flags
- use a limited amount of replay
- validate whether the platform fits internal workflows
That makes PostHog especially attractive for developer-led startups, early PLG teams, internal tools, side projects, and teams migrating away from expensive analytics contracts.
The catch is simple: the free plan proves value, but it can also normalize broad instrumentation before anyone sets cost rules.
PostHog Pricing by Product
Once you exceed free tier limits, PostHog charges tiered rates with step-down pricing where higher volumes mean a lower per-unit cost.
Product Analytics Events
| Monthly Volume | Price per Event |
|---|---|
| 1-2 million | $0.00005 |
| 2-15 million | $0.0000343 |
| 15-50 million | $0.0000295 |
| 50-100 million | $0.0000218 |
| 100-250 million | $0.000015 |
| 250+ million | $0.000009 |
Example: 12M events in a month
- First 1M: $0 (free)
- Next 1M @ $0.00005/event = $50
- Remaining 10M @ $0.0000343/event = $343
- Total: $393/month
Session Replay
Web Session Replay:
| Recording Count | Price per Recording |
|---|---|
| 5-15K | $0.0050 |
| 15-50K | $0.0035 |
| 50-150K | $0.0020 |
| 150-500K | $0.0017 |
| 500K+ | $0.0015 |
Mobile Session Replay:
| Recording Count | Price per Recording |
|---|---|
| 2.5-15K | $0.0100 |
| 15-50K | $0.0070 |
| 50-150K | $0.0040 |
| 150-500K | $0.0034 |
| 500K+ | $0.0030 |
Feature Flags & A/B Testing
| Trigger Event Volume | Price per Event |
|---|---|
| 10-50K | $0.0005 |
| 50-100K | $0.0003 |
| 100K-1M | $0.00015 |
| 1-10M | $0.0001 |
| 10-100M | $0.00005 |
| 100M+ | $0.000025 |
Real-World Cost Examples
| Company Size | Monthly Events | Replays | Flags | Monthly Cost | Annual Cost |
|---|---|---|---|---|---|
| Startup (Freemium) | 1M | 0 | 0 | $0 | $0 |
| Growth Stage | 5M | 5K | 50K | $180 | $2,160 |
| Mid-Market | 20M | 15K | 200K | $715 | $8,580 |
| Scale-Up | 50M | 50K | 500K | $1,630 | $19,560 |
| Enterprise | 100M+ | 150K+ | 2M+ | $2,500+ | $30K+ |
Where PostHog Costs Start Rising
1. Event volume grows faster than the team expects
Usage-based pricing looks cheap when you only model signups, page views, and a handful of activation events. It looks very different once product, growth, and engineering each start creating their own event streams.
Common reasons event volume spikes:
- tracking every UI interaction instead of decision-grade events
- duplicate events across client and server
- staging or QA environments leaking into production tracking
- verbose autocapture without cleanup
- using analytics events for debugging rather than product insight
The platform is not the problem here. The real issue is instrumentation discipline.
If your team treats events like free logs, costs rise. If you treat them like business signals, PostHog stays efficient much longer.
2. Session replay becomes the quiet budget driver
Replay is where many teams underestimate spend.
At first, replay feels inexpensive because sampled recordings are incredibly useful. You can see onboarding friction, broken forms, rage clicks, and support issues without guessing. But replay costs climb quickly when teams record too much traffic.
Replay gets expensive when you:
- capture every anonymous session
- leave replay enabled across low-value pages
- store replay for debugging issues that basic analytics could already answer
- use it as a blanket default instead of a targeted diagnostic tool
For most SaaS products, replay works best when it is constrained to meaningful cohorts such as:
- trial users
- paid accounts with onboarding issues
- sessions that hit key drop-off points
- bug-reporting cohorts
3. Feature flags are cheap until they become infrastructure
Feature flags are one of PostHog's strongest selling points. They let teams ship safely, test gradually, and connect releases to actual product behavior.
But once flags become embedded across many environments, apps, and user flows, they stop being a small add-on and start behaving like core infrastructure.
That is not necessarily bad. It just means pricing should be evaluated against the broader stack you are replacing.
If PostHog lets you avoid paying for a separate flagging tool, the economics still work well. If you only need occasional releases and basic toggles, the additional usage may be harder to justify.
4. Warehouse syncs and advanced products increase complexity
A lot of teams start with "we just need analytics" and later expand into warehousing, experiments, or adjacent products.
That expansion is often rational. The problem is that a once-simple bill becomes multi-line-item pricing with different unit drivers. Finance now has to understand event volume, replay usage, flag requests, data sync frequency, and retention assumptions.
That is the moment when transparent pricing still feels operationally complex.
What PostHog Is Good Value For
PostHog is usually strong value when your team needs deep product analytics plus engineering control.
It is a strong fit for:
- teams comfortable instrumenting events well
- companies that want analytics, replay, experiments, and feature flags in one ecosystem
- products with technical teams who care about SQL, data ownership, and implementation flexibility
- businesses that dislike opaque enterprise pricing
The value improves further when PostHog replaces multiple point tools.
For example, if PostHog covers:
- product analytics
- replay
- feature flags
- experimentation
then even a growing monthly bill may still beat a stack of separate vendors.
What PostHog Is Not Built For
PostHog is not the best fit for every product team.
If your main problem is user adoption, not behavioral analytics depth, you may be buying power you do not need.
Teams often overbuy analytics when their real bottlenecks are:
- users not completing onboarding
- poor feature discovery
- no in-app guidance
- weak checklists or product tours
- limited feedback collection
- slow iteration by non-technical product teams
In those cases, a product adoption platform can deliver faster business value because it helps you change behavior inside the product rather than only measure it.
PostHog vs Alternatives
| Tool | Best for | Pricing model | Strength | Tradeoff |
|---|---|---|---|---|
| PostHog | Technical teams needing analytics depth | Usage-based | Analytics + replay + flags in one stack | Costs rise with broad instrumentation |
| Amplitude | Large organizations focused on analytics maturity | Enterprise / packaged | Strong analytics workflows and governance | Higher cost and less transparent pricing |
| Mixpanel | PM and growth teams wanting polished analytics UX | Packaged / enterprise | Easy exploration for non-engineers | Cost can rise sharply at scale |
| Heap | Teams prioritizing automatic capture | Usage-based / packaged | Fast setup and retroactive analysis feel | Less control over signal quality without cleanup |
| Statsig | Experiment-heavy product orgs | Usage-based | Feature delivery + experimentation strength | Less of a full product adoption platform |
| Userorbit | Lean SaaS teams focused on activation and adoption | Transparent subscription tiers | Tours, checklists, surveys, announcements, feedback | Lighter than PostHog for deep analytics workflows |
PostHog vs Amplitude
Amplitude is typically chosen by teams that want a mature analytics environment with strong collaboration and stakeholder-friendly workflows. PostHog wins when you want more engineering flexibility and clearer pricing.
Choose Amplitude if your organization primarily optimizes around behavioral analysis, stakeholder reporting, and enterprise analytics workflows.
Choose PostHog if your team wants:
- stronger developer ownership
- integrated replay and flags
- open-source roots and deployment flexibility
- a more transparent path from free usage to paid growth
PostHog vs Mixpanel
Mixpanel is often easier for non-technical teams to navigate quickly. PostHog generally wins on platform breadth and engineering friendliness.
Choose Mixpanel if the priority is fast self-serve analysis for PM and growth teams.
Choose PostHog if you want the surrounding product stack, not just event analysis.
PostHog vs Statsig
This comparison matters more in 2026 because more teams want shipping control and experimentation tied together.
Statsig is compelling when experimentation and release workflows are central. PostHog is stronger when analytics remains the core use case and flagging is part of the same environment.
PostHog vs Userorbit
This is not a pure apples-to-apples comparison, which is exactly why it matters.
PostHog helps you understand what users did and test releases with more precision.
Userorbit helps product teams improve how users get to value through:
- in-app tours
- onboarding checklists
- announcements
- surveys
- feedback loops
- roadmap and adoption workflows
If your team already knows where activation drops and now needs to fix the experience without heavy engineering work, Userorbit can be the better operational fit.
If you need event-level analysis, replay, flags, and experiment workflows, PostHog remains the better analytics engine.
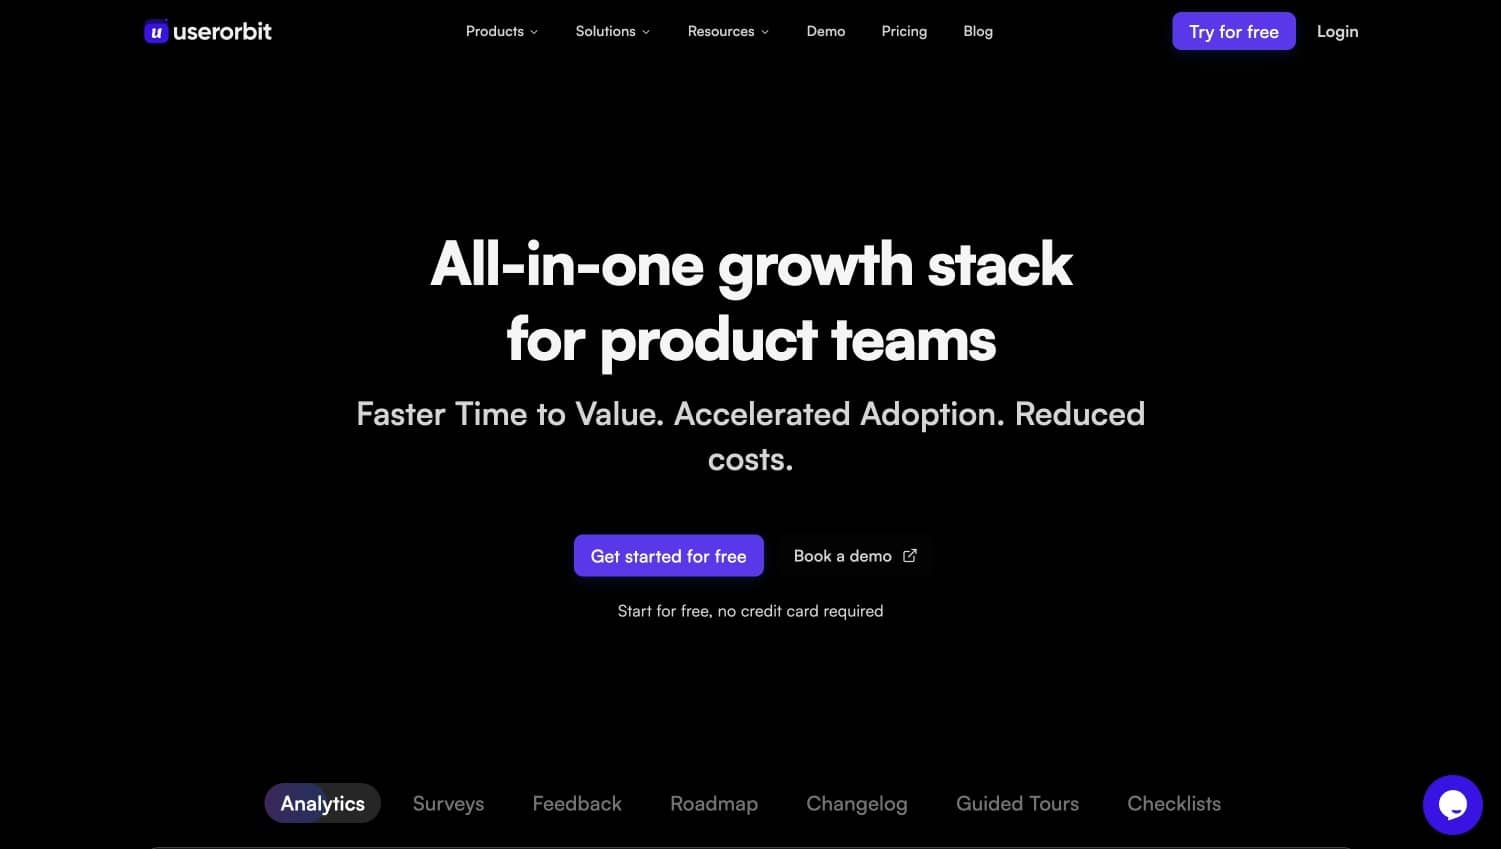
Product experience platform for modern teams
How to Keep PostHog Affordable
The best way to control PostHog cost is not negotiation. It is instrumentation hygiene.
Use a strict event taxonomy
Define a small set of events that map to product decisions. If an event will not influence a roadmap, experiment, onboarding improvement, or KPI review, it probably should not exist.
Sample replay aggressively
Do not replay everything. Start with high-value moments:
- onboarding sessions
- checkout or conversion flows
- bug-report sessions
- users who churn or stall
Separate production from noise
Make sure QA, local, and staging traffic are excluded or clearly isolated. Test traffic quietly inflates usage and pollutes analysis.
Review flags quarterly
Flags accumulate. Old flags still create cognitive load and, in some implementations, avoidable usage. Clean them up like technical debt.
Give one owner responsibility for spend
A usage-based stack without ownership turns into a shared-cost blind spot. One person should review monthly usage and ask a simple question: which of these meters is still earning its keep?
Is PostHog Worth the Price?
For many technical SaaS teams, yes.
PostHog is worth paying for when:
- you need analytics depth beyond basic dashboards
- product and engineering work closely together
- you want replay and feature flags in the same ecosystem
- you prefer transparent pricing over enterprise sales friction
It becomes less compelling when:
- you mainly need onboarding and adoption tooling
- your non-technical teams need to launch in-app experiences themselves
- your instrumentation discipline is weak
- replay and event volume are growing without clear ROI
Who Should Choose PostHog
Choose PostHog if you are:
- a product-led SaaS with a technical team
- a company replacing several data tools with one flexible stack
- a team that values open, inspectable pricing
- an org that will actively manage instrumentation quality
Who Should Look Elsewhere
Look at alternatives if you are:
- a lean product team focused more on activation than analytics depth
- a startup that wants no-code onboarding more than event-heavy analysis
- a non-technical team that needs immediate in-app guidance tools
- an org where usage-based cost control is likely to drift
FAQ
Does PostHog charge per seat?
No. One of PostHog's biggest advantages is that it avoids per-seat pricing. That keeps collaboration easier as more teammates need access.
What makes PostHog expensive?
Usually not the base analytics layer. Costs often rise because of broad event capture, replay volume, and expanded use of additional products like flags or warehouse syncs.
Is PostHog cheaper than enterprise analytics tools?
Often yes, especially for technical teams that manage usage carefully. It can still become expensive if instrumentation grows without controls.
What is the best alternative to PostHog?
That depends on the job. For analytics maturity, teams often compare Amplitude, Mixpanel, Heap, and Statsig. For product adoption and in-app activation work, Userorbit is often the more practical alternative.
Final Verdict
PostHog has some of the clearest pricing logic in modern product infrastructure. That is why so many teams trust it. You can start free, expand gradually, and understand where spend is coming from.
But transparent pricing does not automatically mean cheap pricing.
The moment your team tracks too much, replays too broadly, or adds adjacent products without usage controls, the bill gets heavier. For technical teams, that is often still worth it because PostHog replaces multiple tools and supports serious product analysis. For adoption-focused teams, it can be more stack than they actually need.
If your question is, "Do we need a powerful analytics and experimentation stack?" PostHog is one of the better answers.
If your question is, "How do we get more users to activation faster?" a lighter product adoption platform may create ROI sooner.